


NCERT-MOTION AND TIME-Exercise
- Classify the following as motion along a straight line, circular orosc...
Text Solution
|
- Classify the following as motion along a straight line, circular orosc...
Text Solution
|
- Classify the following as motion along a straight line, circular orosc...
Text Solution
|
- Which of the following are not correct? The basic unit of time is se...
Text Solution
|
- Which of the following are not correct? Every object moves with a co...
Text Solution
|
- Which of the following are not correct? Distances between two cities...
Text Solution
|
- Which of the following are not correct? The time period of a given p...
Text Solution
|
- Which of the following are not correct? The speed of a train is expr...
Text Solution
|
- A simple pendulum takes 32 s to complete 20 oscillations. What is the ...
Text Solution
|
- The distance between two stations is 240 km. A train takes 4 hours to ...
Text Solution
|
- The odometer of a car reads 57321.0 km when the clock shows the time 8...
Text Solution
|
- Salma takes 15 minutes from her house to reach her school on a bicycle...
Text Solution
|
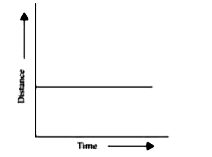
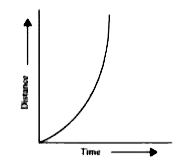
- Show the shape of the distance-time graph for the motion in the follow...
Text Solution
|
- Show the shape of the distance-time graph for the motion in the follow...
Text Solution
|
- Which of the following relations is correct?
Text Solution
|
- The basic unit of speed is:
Text Solution
|
- A car moves with a speed of 40 km/h for 15 minutes and then with a spe...
Text Solution
|
- Suppose the two photographs, shown in Figure 1 and Figure 2, had been ...
Text Solution
|
- Figure shows the distance-time graph for the motion of two vehicles A ...
Text Solution
|
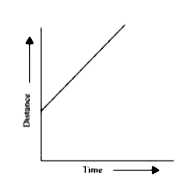
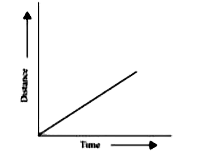
- Which of the following distance-time graphs shows a truck moving with ...
Text Solution
|