Home
Class 14
MATHS
The given bar graph presents the target ...

The given bar graph presents the target and actual production of AC machines of a factory over five months

The ratio of the combined target production of AC machines in January and April to that of the combined actual production of AC Machines in March and April was

A

`4:5`

B

`3:2 `

C

`5:6`

D

`2:3`

Text Solution

Verified by Experts

Promotional Banner

Topper's Solved these Questions

  • SSC CGL MAINS ALL MENSURATION QUES 2018

    PINNACLE|Exercise Exercise|36 Videos
  • SSC MATHS MAINS 2018 TRIGNOMETRY

    PINNACLE|Exercise Exercise|29 Videos

Similar Questions

Explore conceptually related problems

The given Bar Graph presents the Target and Actual production of AC Machines (numbers in thousands) of a factory over five months. दिया गया दंड आरेख पांच महीनों के दौरान एक फैक्ट्री में एसी मशीनों के उत्पादन का लक्ष्य तथा वास्तविक उत्पाद को दर्शाता है | The ratio of the combined target production of AC Machines in January and April to that of the combined actual production of AC Machines in March and April was: जनवरी और अप्रेल में एसी मशीनों के उत्पादन के संयुक्त लक्ष्य तथा मार्च और अप्रैल में एसी मशीनों के वास्तविक संयुक्त उत्पादन में क्या अनुपात है ?

The bar graph given below shows the target and actual production of cement ( in thousand tons ) during 2013-2017. What percentage of the total targeted production of cement from 2013 to 2017 is the total actual production in 2014, 2015 and 2017? ( correct to one decimal place ) नीचे दिया गया दंड आरेख 2013-2017 के दौरान सीमेंट के लक्षित और वास्तविक उत्पादन (हजार टन में) को दर्शाता है | 2013 से 2017 तक सीमेंट के कुल लक्षित उत्पादन का कितना प्रतिशत, 2014, 2015 और 2017 में कुल वास्तविक उत्पादन है ? (दशमलव के एक स्थान तक)

The bar graph given below shows the target and actual production of cement ( in thousand tons ) during 2013-2017. The ratio of the target production in 2014 and 2016 to the actual total production in 2013, 2016 and 2017 is : नीचे दिया गया दंड आरेख 2013-2017 के दौरान सीमेंट के लक्षित और वास्तविक उत्पादन (हजार टन में) को दर्शाता है | वर्ष 2014 और 2016 में सीमेंट के कुल लक्षित उत्पादन और 2013, 2016 तथा 2017 में कुल वास्तविक उत्पादन का अनुपात है :

The bar graph given below shows the target and actual production of cement ( in thousand tons ) during 2013-2017. Out of given 5 years, in which years the target production of the cement was 45% more than the average actual production ? नीचे दिया गया दंड आरेख 2013-2017 के दौरान सीमेंट के लक्षित और वास्तविक उत्पादन (हजार टन में) को दर्शाता है | दिए गए 5 वर्षों में से किन वर्षों में सीमेंट का लक्षित उत्पादन, सीमेंट के औसत वास्तविक उत्पादन से 45% अधिक था ?

The bar graph given below shows the data of the production of paper (in lakh tonnes) by three different companies P, Q and R over the years. What is the ratio of the average production by company P during the period 2010 to 2013 to the average production by company R during the same period?

Given below is the bar graph showig the number of scooters produced in a factory during the first five months of a year. Read the above bar graph carefully nd answer the question given below: How many scooters were produced in the month of March? What was the increase in proudction in Feberuary over the production in January ? What was teh decrease in proudction in March in comparison to the production in February ? In which month was the production minimum and what was it ?

PINNACLE-SSC CHSL 2018 QUESTION PAPER-Exercise
  1. The ratio of incomes of A and B is 2 : 3 and that of their expenditure...

    Text Solution

    |

  2. A person sold an article at a loss of 8%. Had he sold it at a gain of ...

    Text Solution

    |

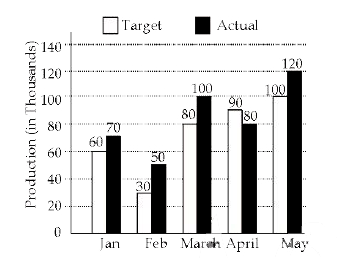
  3. The given bar graph presents the target and actual production of AC ma...

    Text Solution

    |

  4. There are 90 students in a class, out of which 70% are from village A ...

    Text Solution

    |

  5. A is 20% more than B, B is 25% more than C, C is 60% less than D and D...

    Text Solution

    |

  6. In triangle ABC ,D and E are the points on sides AB and AC, respective...

    Text Solution

    |

  7. In Delta ABC, AB = 7 cm, BC = 24 cm and AC = 25 cm. If G is the centro...

    Text Solution

    |

  8. If 30 persons take 10 days to complete a certain work working 8 hours ...

    Text Solution

    |

  9. The volume of a right circular cone is 924 cubic cm. If it.s height is...

    Text Solution

    |

  10. The total target production of AC machines in February, April and May ...

    Text Solution

    |

  11. If the eight-digit number 342x18y6 is divisible by 72, then what is th...

    Text Solution

    |

  12. If cot theta = 1/sqrt3 then the value of (2 - sin^(2)theta)/(1- cos^(2...

    Text Solution

    |

  13. Two circles of radius 15 cm and 12 cm intersect each other, and the le...

    Text Solution

    |

  14. The actual production of Ac machines in April was that percentage mor...

    Text Solution

    |

  15. The value of (3 div {5-5 div (6-7)xx8+9})/(4+4xx4 div 4 of 4) is (3 ...

    Text Solution

    |

  16. If a +b+c=5, a^2+b^2+c^2 =27, and a^3+b^3+c^3=125, then the value of 4...

    Text Solution

    |

  17. 3 sqrt(3x)^3 - 2 sqrt2y^3 = (sqrt3x - sqrt2y)(Ax^2 - Bxy + Cy^2), then...

    Text Solution

    |

  18. In which month the actual production of AC machines was 25% more than ...

    Text Solution

    |

  19. A sum of Rs 7,500 amounts to Rs 8,748 after 2 years at a certain compo...

    Text Solution

    |

  20. If 1/(sec theta-tan theta)-1/(cos theta)= Sec theta xx k, ,0^@< theta<...

    Text Solution

    |