Home
Class 14
MATHS
The given bar graph presents Different t...

The given bar graph presents Different type of Vehicles exported by a company in 2016 and 2017?

The export of which type of vehicle in 2017 is approximately 18.3% more than that export of same type of vehicle in 2016.

A

C

B

D

C

E

D

B

Text Solution

Verified by Experts

Promotional Banner

Topper's Solved these Questions

  • SSC CGL MAINS ALL MENSURATION QUES 2018

    PINNACLE|Exercise Exercise|36 Videos
  • SSC MATHS MAINS 2018 TRIGNOMETRY

    PINNACLE|Exercise Exercise|29 Videos

Similar Questions

Explore conceptually related problems

The given Bar Graph presents the number of different types of vehicles exported by a company in 2017 and 2018.The average export of vehicles in 2018 is what percent more than the export of vehicle A in 2017? दिया गया दंड आरेख एक कंपनी के द्वारा 2017 और 2018 में निर्यात किये गए अलग-अलग प्रकार के वाहनों की संख्या को दर्शाता है | 2018 में वाहनों का औसत निर्यात 2017 में वाहन A के निर्यात से कितना प्रतिशत अधिक है ?

The given Bar Graph presents the number of different types of vehicles exported by a company in 2017 and 2018.What is the ratio of the total number of vehicles exported in 2017 of types B, C and D to that of vehicles exported in 2018 of the types A, D and E? दिया गया दंड आरेख एक कंपनी के द्वारा 2017 और 2018 में निर्यात किये गए अलग-अलग प्रकार के वाहनों की संख्या को दर्शाता है | 2017 में निर्यात किये गए B, C और D प्रकार के वाहनों की कुल संख्या का 2018 में निर्यात किये गए A, D और E प्रकार के वाहनों की संख्या के साथ अनुपात ज्ञात करें |

The given Bar Graph presents different types of vehicles (in lakhs) exported by a company in 2016 and 2017.What is the ratio of the total number of vehicles of type D and E exported by the company in 2016 to that of vehicles of type C and E exported in 2017? दिया गया दंड आरेख (बार ग्राफ) 2016 और 2017 में किसी कंपनी द्वारा निर्यात किए गए विभिन्‍न प्रकार के वाहनों (लाखों में) को दर्शाता है| 2016 में कंपनी द्वारा निर्यात किए जाने वाले D और E टाइप के वाहनों की कुल संख्या और 2017 में निर्यात किए गए C और E टाइप के वाहनों का अनुपात क्‍या है?

The given Bar Graph presents Different Type of Vehicles (in lakhs) exported by a company in 2016 and 2017. The total number of vehicles of type C and E exported by the company in 2017 is what percentage (correct to one decimal place) more than the total number of vehicles of type A, B and C exported in 2016?

The given Bar Graph presents different types of vehicles (in lakhs) exported by a company in 2016 and 2017. The average number of all types of vehicles exported by the company in 2016 is what percent less than the number of type B vehicles exported in 2017? दिया गया दंड आरेखा (बार ग्राफ) 2016 और 2017 में किसी कंपनी द्वारा निर्यात किए गए विभिन्‍न प्रकार के वाहनों (लाखों में) को दर्शाता है| 2016 में कंपनी दवारा निर्यात किए गए सभी प्रकार के वाहनों की औसत संख्या, 2017 में निर्यात किए गए टाइप B वाहनों की संख्या से कितने प्रतिशत कम है?

The given Bar Graph presents the number of different types of vehicles exported by a company in 2017 and 2018.The increase in the exports in 2018 as compared to that in 2017 is closest to 32% in case of vehicles of type: दिया गया दंड आरेख एक कंपनी के द्वारा 2017 और 2018 में निर्यात किये गए अलग-अलग प्रकार के वाहनों की संख्या को दर्शाता है | किस प्रकार के वाहनों के मामले में 2017 की तुलना में 2018 में निर्यात में हुई वृद्धि 32% के लगभग है :

The given Bar Graph presents the number of different types of vehicles (in lakhs) exported by a company during 2014 and 2015. The Average number of type A, B and D vehicles exported in 2015 was x% less than the number of type E vehicles exported in 2014. what is the value of x?

The given Bar Graph presents Different Type of Vehicles (in lakhs) exported by a company in 2016 and 2017. दिया गया दंड आरेख 2016 और 2017 में एक कंपनी के द्वारा निर्यात किये गए अलग-अलग प्रकार के वाहनों ( लाख में ) को दर्शाता है | The export of which type of vehicle in 2017 is approximately 18.3% more than the export of same type of vehicle in 2016? 2017 में किस प्रकार के वाहन का निर्यात 2016 में इसी वाहन के निर्यात से लगभग 18.3% अधिक है ?

PINNACLE-SSC CHSL 2018 QUESTION PAPER-Exercise
  1. An article is marked at a price which is 1.2 times its cost price. Aft...

    Text Solution

    |

  2. A vendor bought 40 dozen of fruits for Rs2400. Out of these, 30 fruits...

    Text Solution

    |

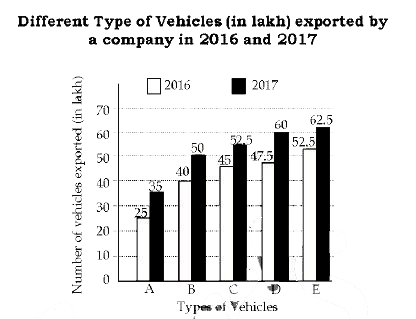
  3. The given bar graph presents Different type of Vehicles exported by a ...

    Text Solution

    |

  4. The average weight of the students in a group was 75.4 kg. Later on, f...

    Text Solution

    |

  5. If x is real and x^(4) - 5x^(2) - 1 = 0, when the value of (x^(6) - 3x...

    Text Solution

    |

  6. The given Bar Graph presents different types of vehicles (in lakhs) ex...

    Text Solution

    |

  7. The given Bar Graph presents Different Type of Vehicles (in lakhs) exp...

    Text Solution

    |

  8. The given Bar Graph presents different types of vehicles (in lakhs) ex...

    Text Solution

    |

  9. If x+y+z=2, xy+yz+zx= 11, then the value of x^3 +y^3 +z^3 - 3xyz is: य...

    Text Solution

    |

  10. A 360 m long train running at a uniform speed, crosses a platform in 5...

    Text Solution

    |

  11. The ratio of speeds of A and B is 3:5. If A takes 24 minutes more than...

    Text Solution

    |

  12. The given bar graph presents the number of students enrolled for a voc...

    Text Solution

    |

  13. If x + (1)/(x) = 7, then x^(3) + (1)/(x^(3)) is equal to :

    Text Solution

    |

  14. If 250sqrt2x^3 − 5sqrt5y^3 = (5sqrt2x − sqrt5y) xx (Ax^2 + Bxy + Cy^2)...

    Text Solution

    |

  15. Two numbers A and B are in the ratio 5 : 2. If 4 is added to each numb...

    Text Solution

    |

  16. The given Bar Graph presents the number of students enrolled for a voc...

    Text Solution

    |

  17. A certain sum amounts to Rs 29282 in 4 years at 10% per annum, when th...

    Text Solution

    |

  18. What is the ratio of the total numbers of students enrolled in A durin...

    Text Solution

    |

  19. A rectangle ABCD is inscribed in a circle with centre O. Its diagonal ...

    Text Solution

    |

  20. By selling an article for Rs2,300, Rekha gains 25%. If she sells it fo...

    Text Solution

    |