Home
Class 14
MATHS
The given bar graph presents the number ...

The given bar graph presents the number of students enrolled for a vocational course in institutes A and B during a period of five years.

percentage the number of students enrolled in B more than the number of students enrolled in A during 2017?

A

28

B

25

C

30

D

22

Text Solution

Verified by Experts

Promotional Banner

Topper's Solved these Questions

  • SSC CGL MAINS ALL MENSURATION QUES 2018

    PINNACLE|Exercise Exercise|36 Videos
  • SSC MATHS MAINS 2018 TRIGNOMETRY

    PINNACLE|Exercise Exercise|29 Videos

Similar Questions

Explore conceptually related problems

The given Bar Graph presents the number of students enrolled for vocational course institutes A and B during a period of 5 years. In which year the number of students enrolled in B is x% more, where 25 lt x lt 30 , then the number of students enrolled in A in the same year? दिया गया दंड आरेख (बार ग्राफ) 5 वर्ष की अवधि के दौरान संस्थान A और B में व्यावसायिक पाठ्यक्रम के लिए नामांकित विद्यार्थियों की संख्या को दर्शाता है| किस वर्ष में संस्थान B में नामांकित विद्यार्थियों की संख्या उसी वर्ष संस्थान A में नामांकित विद्यार्थियों की संख्या से x % अधिक है, जहां 25 lt x lt 30 है?

Study the below table and answer the question. The number of students enrolled for a Vocational Course (VC) in Institutes A, B, C, D and E during 6 years The average number of students enrolled in VC in Institute C in six years is what percentage more than the number of students enrolled in Institute E in 2015 (correct to one decimal place)?

Study the below table and answer the question. The number of students enrolled for a Vocational Course (VC) in Institutes A, B, C, D and E during 6 years: The total number of students enrolled in VC in Institutes C,D and E in 2017 exceeds the total number of students enrolled in Institute B in 2015, 2017 and 2019 by x, where x lines between :

Study the below table and answer the question. The number of students enrolled for a Vocational Course (VC) in Institutes A, B, C, D and E during 6 years: The total number of students enrolled in VC in Institute A in 2014, 2016 and 2017 is what percentage of the total number of students enrolled in VC in all the five institutes in 2019?

The given Bar graph presents the numbers of students from Science and Arts streams from a school in different years. The average of number of Science stu- dents in 2011, 2013 and 2015 is what percentage more than the number of Arts students in 2011?

The given Bar Graph presents the number of students enrolled for a vocational course in institutes A and B during a period of five years. दिया गया दंड आरेख A और B संस्थानों में पांच वर्षों की अवधि के दौरान व्यावसायिक पाठ्यक्रमों नामांकन लेने वाले छात्रों की संख्या को दर्शाता है | The average number of students (per year) enrolled in B during 2015, 2016 and 2018 is what percentage more than the number of students enrolled in A during 2017? 2015, 2016 और 2018 में B में नामांकन ( प्रति वर्ष ) लेने वाले छात्रों की औसत संख्या 2017 के दौरान A में नामांकन लेने वाले छात्रों की संख्या से कितना प्रतिशत अधिक है ?

PINNACLE-SSC CHSL 2018 QUESTION PAPER-Exercise
  1. A 360 m long train running at a uniform speed, crosses a platform in 5...

    Text Solution

    |

  2. The ratio of speeds of A and B is 3:5. If A takes 24 minutes more than...

    Text Solution

    |

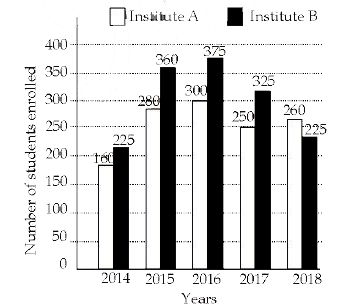
  3. The given bar graph presents the number of students enrolled for a voc...

    Text Solution

    |

  4. If x + (1)/(x) = 7, then x^(3) + (1)/(x^(3)) is equal to :

    Text Solution

    |

  5. If 250sqrt2x^3 − 5sqrt5y^3 = (5sqrt2x − sqrt5y) xx (Ax^2 + Bxy + Cy^2)...

    Text Solution

    |

  6. Two numbers A and B are in the ratio 5 : 2. If 4 is added to each numb...

    Text Solution

    |

  7. The given Bar Graph presents the number of students enrolled for a voc...

    Text Solution

    |

  8. A certain sum amounts to Rs 29282 in 4 years at 10% per annum, when th...

    Text Solution

    |

  9. What is the ratio of the total numbers of students enrolled in A durin...

    Text Solution

    |

  10. A rectangle ABCD is inscribed in a circle with centre O. Its diagonal ...

    Text Solution

    |

  11. By selling an article for Rs2,300, Rekha gains 25%. If she sells it fo...

    Text Solution

    |

  12. A wire is in the shape of a rectangle whose sides are in the ratio 7 :...

    Text Solution

    |

  13. A and B together can do a piece of work in 10 days, B and C together c...

    Text Solution

    |

  14. A man gets a discount of 30% and then 20% on his food bill. How much e...

    Text Solution

    |

  15. If sqrt((1-cosθ)/(1+cosθ)) xx sqrt((cosecθ -cot θ)/(cosecθ +cot θ))= ...

    Text Solution

    |

  16. If (1/(1-sin theta) +1/(1+sin theta)) = 4sec theta, 0^circ lt theta lt...

    Text Solution

    |

  17. Given four different numbers, the average of first three numbers is fo...

    Text Solution

    |

  18. The simplified value of (7/5 div 7/10 of 3/4) div 4/9- (7/16 div 10 1/...

    Text Solution

    |

  19. The price of a commodity is increased by 36% and the quantity purchase...

    Text Solution

    |

  20. If x≠ − 1 , 2 and 5, then the simplified value of {(2(x^3 -8))/(x^2-x ...

    Text Solution

    |