Home
Class 14
MATHS
The given Bar Graph presents Income and ...

The given Bar Graph presents Income and Expenditure (in crores of Rupees) of a company for five years, 2014 to 2018. What is the ratio of total Expenditure to total Income of the company in 2014,2016 and 2017?

A

`13 : 18`

B

`3 :4`

C

`15: 16`

D

`5:6`

Text Solution

Verified by Experts

Promotional Banner

Topper's Solved these Questions

  • SSC CGL MAINS ALL MENSURATION QUES 2018

    PINNACLE|Exercise Exercise|36 Videos
  • SSC MATHS MAINS 2018 TRIGNOMETRY

    PINNACLE|Exercise Exercise|29 Videos

Similar Questions

Explore conceptually related problems

The given Bar Graph presents the Revenue and Expenditure (in crores of Rupees ) of a company during the five year period, 2014-2018. What is the ratio of the total revenue of the company in 2015 and 2018 to that of its expenditure in 2014 and 2018 ?

The given Bar Graph presents Income and Expenditure (in crores of Rupees) of a company for five years, 2014 to 2018. The total Income of the company in 2015, 2017 and 2018 is approximately what percent less than the total Expenditure in the five years? दिया गया दंड आरेख (बार ग्राफ) 5 वर्षो, 2014 से 2018 के दौरान किसी कंपनी की आय और व्यय (करोड़ रुपए में) को दर्शाता है 2015, 201 और 2018 में कंपनी की कुल आय, 5 वर्षो में कुल व्यय से लगभग कितने प्रतिशत कम है?

The given Bar Graph presents Income and Expenditure (in crores of Rupees) of a company for five years, 2014 to 2018. In which year is the Expenditure more than 40% as compared to the Expenditure in the previous year? दिया गया दंड आरेख (बार ग्राफ) 5 वर्षो, 2014 से 2018 के दौरान किसी कंपनी की आय और व्यय (करोड़ रुपए में) को दर्शाता है| पिछले वर्ष के व्यय की तुलना में किस वर्ष में वह 40% अधिक है?

The given Bar Graph presents Income and Expenditure (in crores of Rupees) of a company for the five years, 2014 to 2018. Income and Expenditure (in a crores) of a company in 5 Years The average Income (per year) of the company in five years is what percentage more than its Expenditure in 2015?

The given Bar Graph presents Income and Expenditure (in crores of Rupees) of a company for five years, 2014 to 2018. The average Income (per year) of the company in five years is what percentage more than its Expenditure in 2015? दिया गया दंड आरेख॑ (बार ग्राफ) 5 वर्षों, 2014 से 2018 के दौरान किसी कंपनी की आय और व्यय (करोड़ रुपए में) को दर्शाता है| 5 वर्षों में कंपनी की (प्रतिवर्ष) औसत आय 2015 में उसके व्यय से कितने प्रतिशत अधिक है?

The given Bar Graph presents the Revenue and Expenditure (in crores of Rupees ) of a company during the five year period, 2014-2018. The total expenditure of the company from 2016 to 2018 is what percentage (neatest to an integer) of the total revenue for the five year period?

The given Bar Graph presents the Revenue and Expenditure (in crores of Rupees ) of a company during the five year period, 2014-2018. The expenditure of the company in 2017 is what percentage less than the average revenue (per year) in 2014, 2015 and 2016 ?

The given bar graph presents the Imports and Exports of an Item (in tonnes) manufactured by a company for the five financial years, 2013-2014 to 2017-2018. What is the ratio of total Exports to total Imports during the five financial years?

PINNACLE-SSC CHSL 2018 QUESTION PAPER-Exercise
  1. A man gets a discount of 30% and then 20% on his food bill of Rs1,250....

    Text Solution

    |

  2. 18 men can complete a work in 9 days. After they have worked for 5 day...

    Text Solution

    |

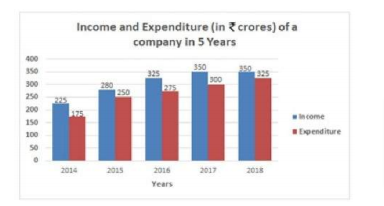
  3. The given Bar Graph presents Income and Expenditure (in crores of Rupe...

    Text Solution

    |

  4. An article is sold for rs 360 after allowing dis-count of 20% on its m...

    Text Solution

    |

  5. In a circle with centre O, a diameter AB and a chord CD intersect each...

    Text Solution

    |

  6. If tan x = cot (60^circ + 6x), then what is the value of x? यदि tan x ...

    Text Solution

    |

  7. If 9a^(2) + 16b^(2) + c^(2) + 25 = 24, (a+b), then the value of (3a + ...

    Text Solution

    |

  8. The length of a rectangular park is 20m more than its breadth. If the ...

    Text Solution

    |

  9. The price of an article increases by 20% every year. If the difference...

    Text Solution

    |

  10. The average of n number is 36. If each of 75% of the numbers is increa...

    Text Solution

    |

  11. If x^2-6x+1=0, then the value of (x^4+1/x^2) div (x^2+1) is: अगर x^...

    Text Solution

    |

  12. For theta being an acute angle, if cosec theta= 1.25, then the value ...

    Text Solution

    |

  13. Three articles are bought at Rs200 each. One of them is sold at a loss...

    Text Solution

    |

  14. ABCD is a cyclic quadrilateral such that its sides AD and BD produced ...

    Text Solution

    |

  15. A can do 40% of a work in 6 days and B can do 30% of the same work in ...

    Text Solution

    |

  16. The given bar graph presents the Revenue and Expenditure of a company ...

    Text Solution

    |

  17. If x + y + z = 3 and xy + yz + zx = -18, then what is the value of x^(...

    Text Solution

    |

  18. If a 10-digit number 75y97405x2 is divisible by 72, then the value of ...

    Text Solution

    |

  19. For 0^@< theta <90^@, if 2cos^2 theta=3sin theta, then the value of (c...

    Text Solution

    |

  20. Sudha decided to donate 12% of her monthly income to an orphanage. On ...

    Text Solution

    |