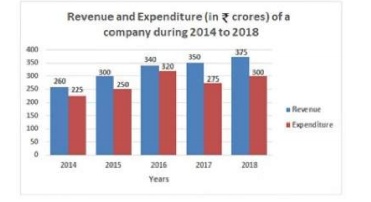
 वर्ष 2016 से 2018 तक कंपनी का कुल व्यय, 5 वर्ष की अवधि के कुल राजस्व का कितना प्रतिशत )पूर्णांक के करीब है)?
 A
B
C
D
Text Solution
Verified by Experts


Recommended Questions
- The given Bar Graph presents the Revenue of Expenditure (in crores of ...
Text Solution
|
- The given Bar Graph presents Income and Expenditure (in crores of Rupe...
Text Solution
|
- The given Bar Graph presents Income and Expenditure (in crores of Rupe...
Text Solution
|
- The given Bar Graph presents Income and Expenditure (in crores of Rupe...
Text Solution
|
- The given Bar Graph presents Income and Expenditure (in crores of Rupe...
Text Solution
|
- The given Bar Graph presents Income and Expenditure (in crores of Rupe...
Text Solution
|
- The given Bar Graph presents Income and Expenditure (in crores of Rupe...
Text Solution
|
- The given Bar Graph presents the Imports and Exports of an item (in to...
Text Solution
|
- The given Bar Graph presents the data of annual income (A) and annual ...
Text Solution
|