Home
Class 14
MATHS
The given Bar Graph presents the Imports...

The given Bar Graph presents the Imports and Exports of an items (in tonnes) manufactured by a company for the five financial Years, 2013-2014 to 2017-2018.
दिया गया दंड आरेख (बार ग्राफ) 5 वित्त वर्षों, 2013-2014 से 2011-2018, के दौरान किसी कंपनी द्वारा निर्मित किसी वस्तु के आयात और निर्यात (टन में) को दर्शाता है|
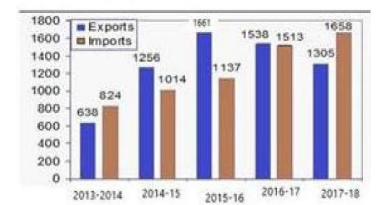
What is the ratio of total Exports to total Imports during the five financial Years?
5 वित्त वर्षों के दौरान कुल निर्यात और कुल आयात का अनुपात क्या है?

A

`3199: 3073`

B

`4175: 4011`

C

`3073: 3199`

D

`4011: 4175`

Text Solution

Verified by Experts

Promotional Banner

Similar Questions

Explore conceptually related problems

The given Bar Graph presents the Imports and Exports of an item (in tonnes) manufactured by a company for the five financial years, 2013-2014 to 2017-2018. दिया गया दंड आरेख (बार ग्राफ) 5 वित्त वर्षों, 2013-2014 से 2011-2018 के दौरान एक कंपनी द्वारा निर्मित किसी वस्तु (टन में) के आयात और निर्यात को दर्शाता है | What is the ratio of total Imports to total Exports during the five financial years? पांचों वित्त वर्षों के दौरान कुल आयात और कुल निर्यात का अनुपात क्या है?

The given Bar Graph presents the Imports and Exports of an items (in tonnes) manufactured by a company for the five financial Years, 2013-2014 to 2017-2018. दिया गया दंड आरेख (बार ग्राफ) 5 वित्त वर्षों, 2013-2014 से 2011-2018, के दौरान किसी कंपनी द्वारा निर्मित किसी वस्तु के आयात और निर्यात (टन में) को दर्शाता है| What is the average of Import (in tonnes) during the five financial Years? 5 वित्तीय वर्ष के दौरान आयात का औसत (टन में) क्या है?

The given Bar Graph presents the Imports and Exports of an item (in tonnes) manufactured by a company for the five financial years, 2013-2014 to 2017-2018. दिया गया दंड आरेख (बार ग्राफ) 5 वित्त वर्षों, 2013-2014 से 2011-2018 के दौरान एक कंपनी द्वारा निर्मित किसी वस्तु (टन में) के आयात और निर्यात को दर्शाता है | What is the average of Export (in tonnes) during the five financial years? 5 वित्त वर्षों के दौरान निर्यात (टन में] का औसत कितना है?

The given Bar Graph present the Imports and Exports of an item (in tonnes) manufactured by a company for the five financial years, 2013-2014 to 2017-2018. दिया गया दंड आरेख (बार ग्राफ) पांच वित्त वर्षों, 2013-2014 से 2017-2018, के दौरान किसी कंपनी दवारा निर्यात किसी वस्तु (टन में] के आयात और निर्यात को दर्शाता है| What is the average of total Import and Export (in tonnes) during five financial years? पांच वित्त वर्षो के दौरान कुल आयात और निर्यात (टन में) का औसत क्या है?

The given Bar Graph presents the Imports and Exports of an item (in tonnes) manufactured by a company for the five financial years, 2013-2014 to 2017-2018. दिया गया दंड आरेख पांच वित्तीय वर्षो अर्थत 2013-2014 से 2017-2018 तक एक कंपनी के द्वारा निर्मित किसी वस्तु के आयात और निर्यात ( टन में ) को दर्शाता है | What is the average of total Import and Export (in tonnes) during the five financial year? पांच वित्तीय वर्षों के दौरान कुल आयात एवं निर्यात का औसत ( टन में)क्या है ?

The given Bar Graph presents the Imports and Exports of an item (in tonnes) manufactured by a company for the five financial years, 2013-2014 to 2017-2018. दिया गया दंड आरेख पांच वित्तीय वर्षो अर्थत 2013-2014 से 2017-2018 तक एक कंपनी के द्वारा निर्मित किसी वस्तु के आयात और निर्यात ( टन में ) को दर्शाता है | What is the average of Exports (in tonnes) during the five financial years? पांच वित्तीय वर्षों के दौरान निर्यात (टन ) का औसत कया रहा है ?

The given Bar Graph presents the Imports and Exports of an item (in tonnes) manufactured by a company for the five financial years, 2013-2014 to 2017-2018. दिया गया दंड आरेख (बार ग्राफ) 5 वित्त वर्षों, 2013-2014 से 2011-2018 के दौरान एक कंपनी द्वारा निर्मित किसी वस्तु (टन में) के आयात और निर्यात को दर्शाता है | In which financial year, total of Exports and Imports is the highest? किस वित्त वर्ष में नियात और आयात का योगफल सर्वाधिक है?

The given Bar Graph present the Imports and Exports of an item (in tonnes) manufactured by a company for the five financial years, 2013-2014 to 2017-2018. दिया गया दंड आरेख (बार ग्राफ) पांच वित्त वर्षों, 2013-2014 से 2017-2018, के दौरान किसी कंपनी दवारा निर्यात किसी वस्तु (टन में] के आयात और निर्यात को दर्शाता है| What is the ratio of total Imports to total Exports during 2013-2014, 2015-2016 and 2017-2018? 2013-2014, 2015-2016 3X 2017-2018 के दौरान कुल आयात का कुल निर्यात से क्या अनुपात है?

The given Bar Graph present the Imports and Exports of an item (in tonnes) manufactured by a company for the five financial years, 2013-2014 to 2017-2018. दिया गया दंड आरेख (बार ग्राफ) पांच वित्त वर्षों, 2013-2014 से 2017-2018, के दौरान किसी कंपनी दवारा निर्यात किसी वस्तु (टन में] के आयात और निर्यात को दर्शाता है| In which financial year the total of Exports and Imports is the lowest? किस वित्त वर्ष में निर्यात और आयात का कुल जोड़ सबसे कम है?

The given Bar Graph present the Imports and Exports of an item (in tonnes) manufactured by a company for the five financial years, 2013-2014 to 2017-2018. दिया गया दंड आरेख (बार ग्राफ) पांच वित्त वर्षों, 2013-2014 से 2017-2018, के दौरान किसी कंपनी दवारा निर्यात किसी वस्तु (टन में] के आयात और निर्यात को दर्शाता है| In which financial year, the absolute difference of the Export to those of Imports is the lowest? किस वित्त वर्ष में नियात और आयात ओ का निरपेक्ष अंतर [absolute difference) सबसे कम है?