A
B
C
D
Text Solution
Verified by Experts


Recommended Questions
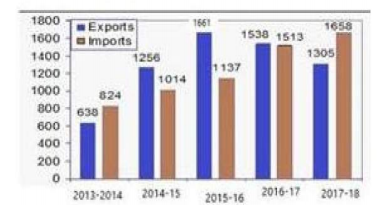
- The given Bar Graph present the Imports and Exports of an item (in ton...
Text Solution
|
- The given Bar Graph presents the Imports and Exports of an item (in to...
Text Solution
|
- The given Bar Graph presents the Imports and Exports of an item (in to...
Text Solution
|
- The given Bar Graph presents the Imports and Exports of an item (in to...
Text Solution
|
- The given Bar Graph presents the Imports and Exports of an item (in to...
Text Solution
|
- The given Bar Graph presents the Imports and Exports of an item (in to...
Text Solution
|
- The given Bar Graph presents the number of different types of vehicles...
Text Solution
|
- The given Bar Graph presents Income and Expenditure (in crores of Rupe...
Text Solution
|
- The given Bar Graph presents the Imports and Exports of an items (in t...
Text Solution
|