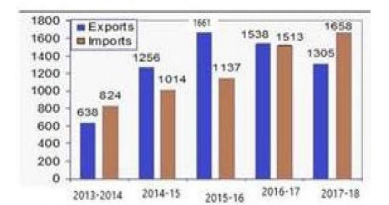
 In which financial year, the absolute difference of the Export to those of Imports is the lowest?
 A
B
C
D
Text Solution
Verified by Experts


Recommended Questions
- The given Bar Graph present the Imports and Exports of an item (in ton...
Text Solution
|
- The given Bar Graph presents the Imports and Exports of an item (in to...
Text Solution
|
- The given Bar Graph presents the Imports and Exports of an item (in to...
Text Solution
|
- The given Bar Graph presents the Imports and Exports of an item (in to...
Text Solution
|
- The given Bar Graph presents the Imports and Exports of an item (in to...
Text Solution
|
- The given Bar Graph presents the Imports and Exports of an item (in to...
Text Solution
|
- The given Bar Graph presents the number of different types of vehicles...
Text Solution
|
- The given Bar Graph presents the Imports and Exports of an items (in t...
Text Solution
|
- The given Bar Graph presents the Imports and Exports of an items (in t...
Text Solution
|