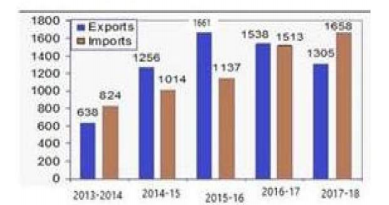
 What is the average absolute difference between Export and Imports (in tonnes) during the five financial years?
A
B
C
D
Text Solution
Verified by Experts


Similar Questions
Explore conceptually related problems
Recommended Questions
- The given Bar Graph present the Imports and Exports of an item (in ton...
Text Solution
|
- The given bar graph presents the Imports and Exports of an item manufa...
Text Solution
|
- The given bar graph presents the imports and Exports of an item manufa...
Text Solution
|
- The given Bar graph presents the Imports and Exports of an item manufa...
Text Solution
|
- The given bar graph (bar graph) shows the import and export (in tonnes...
Text Solution
|
- The given bar graph (bar graph) shows the import and export of an arti...
Text Solution
|
- The given bar graph (bar graph) shows the import and export of an arti...
Text Solution
|
- The given bar graph (bar graph) shows the import and export (in tonnes...
Text Solution
|
- 0.82828282 ......... बराबर है-
Text Solution
|