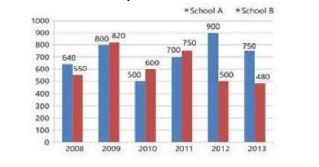
 In which year, percentage increase of students in school A is the highest in comparison to its previous year ?
 A
B
C
D
Text Solution
Verified by Experts


Recommended Questions
- The given Bar Graph presents the number of students of two schools for...
Text Solution
|
- The given Bar Graph presents the number of students of two schools for...
Text Solution
|
- The given Bar Graph presents the number of students of two schools for...
Text Solution
|
- The given Bar Graph presents the number of students of two schools for...
Text Solution
|
- The given Bar Graph presents the number of students of two schools for...
Text Solution
|
- The given Bar Graph presents the number of students of two schools for...
Text Solution
|
- The given Bar Graph presents the number of students of two schools for...
Text Solution
|
- The given Bar Graph presents the number of students of two schools for...
Text Solution
|
- The given Bar Graph presents the number of students of two schools for...
Text Solution
|