Home
Class 14
MATHS
The given Bar Graph presents the number ...

The given Bar Graph presents the number of students of two schools for six years.
दिया गया दंड आरेख छः वर्ष की अवधि में दो विद्यालयों में छात्रों की संख्या को दर्शाता है |
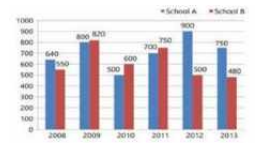
In which year the percentage increase in the number of total students in schools A and B taken together is the highest in comparison to its previous year?
किस वर्ष विद्यालय A और B को मिलाकर कुल छात्रों की संख्या में प्रतिशत वृद्धि पिछले वर्ष की तुलना में सर्वाधिक है ?

A

2012

B

2011

C

2010

D

2009

Text Solution

Verified by Experts

Promotional Banner

Similar Questions

Explore conceptually related problems

The given Bar Graph presents the number of students of two schools for six years. दिया गया दंड आरेख छः वर्ष की अवधि में दो विद्यालयों में छात्रों की संख्या को दर्शाता है | In which year, the percentage increase in students in school B is the highest in comparison to its previous year? किस वर्ष में, विद्यालय B में छात्रों की संख्या में प्रतिशत वृद्धि इसके पिछले वर्ष की तुलना में सबसे अधिक रही है?

The given Bar Graph presents the number of students of two schools for six years. दिया गया दंड आरेख छः वर्ष की अवधि में दो विद्यालयों में छात्रों की संख्या को दर्शाता है | In which year, the percentage increase of students in school A is the highest in comparison to its previous year? किस वर्ष, विद्यालय A में छात्रों की संख्या में प्रतिशत वृद्धि पिछले वर्ष की तुलना में सर्वाधिक है ?

The given Bar Graph presents the number of students of two schools for six years. दिया गया दंड आरेख छः वर्ष की अवधि में दो विद्यालयों में छात्रों की संख्या को दर्शाता है | In which year the sum of the students in two schools is the highest? किस वर्ष, दोनों विद्यालयों के छात्रों का जोड़ सबसे अधिक है ?

The given Bar Graph presents the number of students of two schools for six years. दिया गया दंड आरेख (बार ग्राफ) छह वर्षो के दौरान दो स्कूलों में विद्यार्थियों की संख्या को दर्शाता है| In which year, the percentage increase in students in school B is the highest in comparison to its previous year? किस वर्ष में, स्कूल B के विद्यार्थियों की संख्या में प्रतिशत वृद्धि इसके पिछले वर्ष की तुलना में सबसे अधिक है?

The given Bar Graph presents the number of students of two schools for six years. दिया गया दंड आरेख छः वर्ष की अवधि में दो विद्यालयों में छात्रों की संख्या को दर्शाता है | What is the average (correct to two decimal places) of total students in schools A and B taken together during the six year period? विद्यालय A और B को मिलाकर छः वर्ष की अवधि के दौरान कुल छात्रों का औसत ( दो दशमलव स्थान तक ) क्या है?

The given Bar Graph presents the number of students of two schools for six years. दिया गया दंड आरेख छः वर्ष की अवधि में दो विद्यालयों में छात्रों की संख्या को दर्शाता है | In which year, the absolute difference between the numbers of students in two schools is the highest? किस वर्ष में, दोनों विद्यालयों में छात्रों की संख्या के बीच पूर्ण अंतर सबसे अधिक है ?

The given Bar Graph presents the number of students of two schools for six years. दिया गया दंड आरेख (बार ग्राफ) छह वर्षो के दौरान दो स्कूलों में विद्यार्थियों की संख्या को दर्शाता है| In which year, percentage increase of students in school A is the highest in comparison to its previous year ? किस वर्ष में, स्कूल A की विद्याथियों की संख्या में प्रतिशत वृद्धि इसके पिछले वर्ष की तुलना में सबसे अधिक है?

The given Bar Graph presents the number of students of two schools for six years. दिया गया दंड आरेख छः वर्ष की अवधि में दो विद्यालयों में छात्रों की संख्या को दर्शाता है | What is the ratio of the number of students taken for all years together from school A to that from school B? सभी वर्षों को मिलाकर विद्यालय A और विद्यालय B के छात्रों की संख्या में अनुपात ज्ञात करें |

The given Bar Graph presents the number of students of two schools for six years. दिया गया दंड आरेख छः वर्ष की अवधि में दो विद्यालयों में छात्रों की संख्या को दर्शाता है | What is the average of the number of students from school A during the six year period? छः वर्षों की अवधि में विद्यालय A के छात्रों की संख्या का औसत ज्ञात करें |