 What is the approximate percentage of students passed during 5 academic years (to the nearest integer)?
 A
B
C
D
Text Solution
Verified by Experts


Similar Questions
Explore conceptually related problems
Recommended Questions
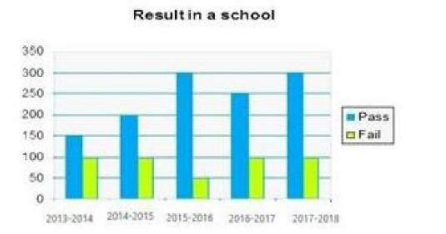
- The given bar graph presents the results in terms of number of student...
Text Solution
|
- The given Bar Graph presents the results in terms of number of student...
Text Solution
|
- The given Bar Graph presents the results in terms of number of student...
Text Solution
|
- The given Bar Graph presents the results in terms of number of student...
Text Solution
|
- The given Bar Graph presents the results in terms of number of student...
Text Solution
|
- The given Bar Graph presents the results in terms of the number of stu...
Text Solution
|
- The given Bar Graph presents the results in terms of the number of stu...
Text Solution
|
- The given Bar Graph presents the results in terms of the number of stu...
Text Solution
|
- The given Bar Graph presents the results in terms of the number of stu...
Text Solution
|