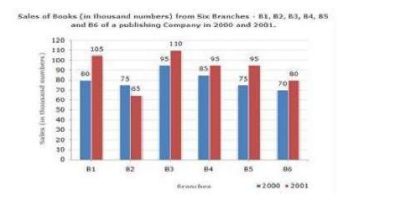
 The ratio of total sales by branches B1, B3 and B5 for both the years to total sales by branches B2, B4, B6 for both the years is:
 A
B
C
D
Text Solution
Verified by Experts


Similar Questions
Explore conceptually related problems
Recommended Questions
- The given Bar Graph present the sales of the number of books (in thous...
Text Solution
|
- Table shows the sales of books (in thousands) from six branches of a p...
Text Solution
|
- The given Bar Graph presents the number of students of two schools for...
Text Solution
|
- The given Bar Graph presents the sales of the number of books (in thou...
Text Solution
|
- The given Bar Graph presents the sales of the number of books (in thou...
Text Solution
|
- The given bar chart, shows the sales of books ( in thousand number) fr...
Text Solution
|
- The given bar graph shows the sale of books (in thousands) in four met...
Text Solution
|
- The Bar graph shown below presents the number of employees in an offic...
Text Solution
|
- The bar graph given below presents the number of books sold by a books...
Text Solution
|