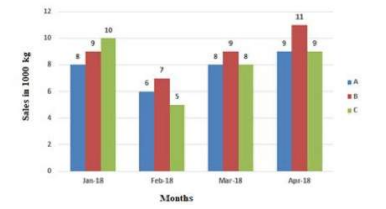
 By how much quantity is the average sale per month from B more or less than that from C?
 A
B
C
D
Text Solution
Verified by Experts


Similar Questions
Explore conceptually related problems
Recommended Questions
- The given Bar Graph presents the sale (in 1000kg) of a particular bran...
Text Solution
|
- The given Bar Graph presents the sale (in 1000 kg) of a particular bra...
Text Solution
|
- The given Bar Graph presents the sale (in 1000 kg) of a particular bra...
Text Solution
|
- The given Bar Graph presents the sale (in 1000 kg) of a particular bra...
Text Solution
|
- The given Bar Graph presents the number of different types of vehicles...
Text Solution
|
- The given Bar Graph presents Income and Expenditure (in crores of Rupe...
Text Solution
|
- The given Bar Graph presents Income and Expenditure (in crores of Rupe...
Text Solution
|
- The given Bar Graph presents the Revenue of Expenditure (in crores of ...
Text Solution
|
- The given bar graph presents the results in terms of number of student...
Text Solution
|