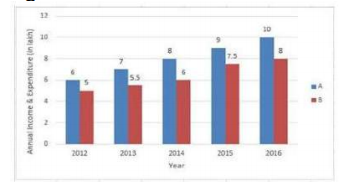
 What was his average monthly saving (in ₹) in 2015 and 2016, taken together (correct to two decimal places)?
 A
B
C
D
Text Solution
Verified by Experts


Recommended Questions
- The given Bar Graph presents the data of annual income (A) and expendi...
Text Solution
|
- Match the following Column A to Column B
Text Solution
|
- The inequation represented by the graph given below is : <img src="htt...
Text Solution
|
- The inequation that best describes the graph given below is <img src=...
Text Solution
|
- The inequation that best describes the following graph is <img src="h...
Text Solution
|
- The given Bar Graph presents Income and Expenditure (in crores of Rupe...
Text Solution
|
- The given Bar Graph presents Income and Expenditure (in crores of Rupe...
Text Solution
|
- The given Bar Graph presents the data of annual income (A) and annual ...
Text Solution
|
- The given Bar Graph presents the data of annual income (A) and annual ...
Text Solution
|