A
B
C
D
Text Solution
Verified by Experts


Similar Questions
Explore conceptually related problems
Recommended Questions
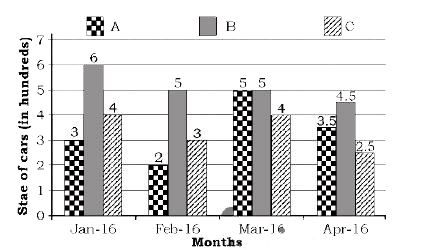
- The given bar graph presents the sales of a particular brand of car by...
Text Solution
|
- Match the following Column A to Column B
Text Solution
|
- The inequation represented by the graph given below is : <img src="htt...
Text Solution
|
- The inequation that best describes the graph given below is <img src=...
Text Solution
|
- The inequation that best describes the following graph is <img src="h...
Text Solution
|
- The given bar graph presents the sale of a particular brand of car by ...
Text Solution
|
- The table shows the number of cars sold by three showrooms over a peri...
Text Solution
|
- The given bar graph present the sale of a particular brand of tea by t...
Text Solution
|
- The given bar graph presents the sales of a particular brand of car by...
Text Solution
|