Home
Class 14
MATHS
The given pie chart shows the quantity w...

The given pie chart shows the quantity wise sales distribution of five products (A, B, C, D and E) of a company in 2016.
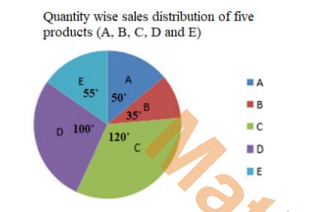
In 2016, if a total of 14616 units were sold, then the number of units of products D sold was:

A

4872

B

4060

C

4263

D

4096

Text Solution

Verified by Experts

Promotional Banner

Topper's Solved these Questions

Similar Questions

Explore conceptually related problems

The given pie chart shows the quantity wise sales distribution of five products (A, B, C. D and E) of a company in 2016. If 320 units of product A were sold by the company, then how many units of products B and E together were sold by the company”?

The given pie chart shows the quantity wise sales distribution of five products (A, B, C, D and E) of a company in 2016. If 1500 units of product D were sold in 2016 and the total number of units sold by the company in 2017 was 18% more than that sold in 2016, then the total units sold by the company in 2017 is:

The given pie chart shows the quantity wise sales distribution of five products (A B C D E) of a company in 2016 If 1500 units of products D were sold in 2016 and the total number of units sold by the company in 2017 was 18% more than that sold in 2016, then the total units sold by the company in 2017 is:

The given pie chart shows the quantity wise sales distribution of five products (A, B, C, D and E) of a company in 2016. दिया गया पाई चार्ट 2016 में एक कंपनी के पाँच उत्पादों ( A, B, C, D और E ) की मात्रा वार बिक्री का वितरण दर्शाता है | If 1500 units of product D were sold in 2016 and the total number of units sold by the company in 2017 was 18% more than that sold in 2016, then the total units sold by the company in 2017 is: यदि 2016 में वस्तु D की 1500 इकाइयाँ बेचीं गयीं और 2017 में कंपनी द्वारा बेचीं गयी इकाइयों की कुल संख्या 2016 में बेचीं गयी इकाइयों की कुल संख्या से 18% अधिक थी, तो 2017 में कंपनी द्वारा बेची गयी कुल इकाइयों की संख्या है

The given pie chart shows the quantity wise sales distribution of five products (A, B, C, D and E) of a company in 2016. दिया गया पाई चार्ट 2016 में एक कंपनी के पाँच उत्पादों ( A, B, C, D और E ) की मात्रा वार बिक्री का वितरण दर्शाता है | If 320 units of product A were sold by the company, then how many units of products B and E together were sold by the company? यदि कंपनी के द्वारा वस्तु A की 320 इकाइयाँ बेची गयीं , तो कंपनी के द्वारा बेची गयी वस्तु B और E की कुल इकाइयों की संख्या ज्ञात करें |

PINNACLE-2018 Main Exam 2nd Shift-EXERCISE
  1. The perimeters of two similar triangles ABC and PQR are 78 cm and 46.8...

    Text Solution

    |

  2. A can do 40% of a work in 12 days, whereas B can do 60% of the same wo...

    Text Solution

    |

  3. The given pie chart shows the quantity wise sales distribution of five...

    Text Solution

    |

  4. The angle of elevation of the top of two vertialtowers as seen from th...

    Text Solution

    |

  5. If the curved surface area of a solid cylinder is one-third of its tot...

    Text Solution

    |

  6. A man sells his goods at a certain price, 20% of which is his profit. ...

    Text Solution

    |

  7. Alloy A contains copper and Zinc in the ratio of 4:3 and alloy B conta...

    Text Solution

    |

  8. In triangle ABC, the medians AD. BE and CF meet at O. What is the rati...

    Text Solution

    |

  9. The value of ((sin A)/(1-cos A)+(1-cos A)/(sinA) div ((cot^2 A)/(1+cos...

    Text Solution

    |

  10. In a quadrilateral ABCD, the bisectors of angle C and angle D meet at ...

    Text Solution

    |

  11. The graphs of the equations 2x + 3y = 11 and x -2y + 12 = 0 intersects...

    Text Solution

    |

  12. Sujata marks an article 36% above the cost price and allows a 40% disc...

    Text Solution

    |

  13. The value of (tan29^@ cot61^@ - cosec^2 61^@) + cot^2 54^@ - sec^2 36^...

    Text Solution

    |

  14. In how many years were the imports more than 80% of the average export...

    Text Solution

    |

  15. The value of (sec phi(1-sin phi)(sin phi+cos phi) (sec phi+tan phi))/(...

    Text Solution

    |

  16. The value of 0.5 bar 6 -0.7 bar23+0.3 bar 9xx 0. bar 7 is : 0.5 ba...

    Text Solution

    |

  17. The area of the base of a right circular cone is 400 pi and its height...

    Text Solution

    |

  18. The given graph shows the marks obtained by students in an examination...

    Text Solution

    |

  19. Renu was sitting inside train A, which was travelling at 50 km/h. Anot...

    Text Solution

    |

  20. The given pie chart shows the quantity wise sales distribution of five...

    Text Solution

    |