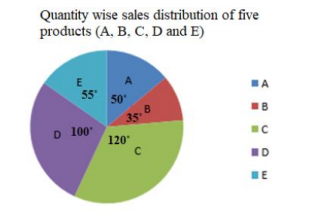
 If 320 units of product A were sold by the company, then how many units of products B and E together were sold by the company”?
A
B
C
D
Text Solution
Verified by Experts


Similar Questions
Explore conceptually related problems
PINNACLE-2018 Main Exam 2nd Shift-EXERCISE
- The given graph shows the marks obtained by students in an examination...
Text Solution
|
- Renu was sitting inside train A, which was travelling at 50 km/h. Anot...
Text Solution
|
- The given pie chart shows the quantity wise sales distribution of five...
Text Solution
|
- The sides of a triangle are 56 cm, 90 cm and 106 cm. The circumference...
Text Solution
|
- The average of 33 numbers is 74. The average of the first 17 numbers i...
Text Solution
|
- Three fractions, x, y and z, are such that x > y > z. When the smalles...
Text Solution
|
- In angle ABC, AB=AC and D is a point on BC. If BD = 5cm, AB =12 cm and...
Text Solution
|
- An article is sold at a certain price. If it is sold at 80% of this pr...
Text Solution
|
- To do a certain work, the ratio of the efficiencies of X and Y is 5:4....
Text Solution
|
- A person sells an article at 16% below its cost price. Had he sold it ...
Text Solution
|
- If x^4-83x^2+1=0, then a value of x^3-x^-3 can be :
Text Solution
|
- The given pie chart shows the quantity wise sales distribution of five...
Text Solution
|
- If 60% of a number is 120 more than 20% of the number, then 28% of the...
Text Solution
|
- The ratio of income of A and B last year was 4:3, respectively. The ra...
Text Solution
|
- The value of (sin(78^@+theta)-cos(12^@-theta)+ (tan^2 70^@-cosec^2 20^...
Text Solution
|
- If the price of petrol increases by 19% and Sunitha intends to spend o...
Text Solution
|
- A solid cube is cut into three cuboids of same volumes. What is the ra...
Text Solution
|
- A sum amounts to Rs 14,395.20 at 9.25% p.a. simple interest in 5.4 yea...
Text Solution
|
- The speed of a boat in still water is 18 km/h and the speed of the cur...
Text Solution
|
- 5 years ago, the ratio of the age of A to that of B was 4:5. Five year...
Text Solution
|