Home
Class 14
MATHS
The bar graph shows the exports of Cars ...

The bar graph shows the exports of Cars of Type A and B

In which year, the exports of cars of type A was 10% more than the average exports of cars of type A over the years

A

2017

B

2014

C

2016

D

2015

Text Solution

Verified by Experts

Promotional Banner

Topper's Solved these Questions

Similar Questions

Explore conceptually related problems

The bar graph shows the exports of Cars of Type A and B (in ₹ millions). What is the ratio of the total exports of cars of type A in 2014 and 2018 to the total exports of cars of type B in 2015 and 2016?

What is the average export of the company B for all the year ?

The table shows the production of different types of cars (in thousands). Study the table carefully and answer the questions The number of years, in which the production of cars of type B is less than the average production of type D cars ovee the years is :

Study the graph and answer the question. In which year, were the exports of type B cars exactly 20% more than the exports of type A cars in 2014?

By what percent the average export of country E over all the given year more than the average export of country C over all the given years ?

In How any of the given years. Were the exports from Company Z more than the average annual exports over the given years ?

Study the graph and answer the question In which year, were the exports of type B cars exactly 20% more than the exports of type A cars in 2014?

Study the graph and answer the question In how many years were the exports of type B cars more than the average exports of type A cars during 2012 to 2016

Study the graph and answer the question. In how many years were the exports of type B cars more than the average exports of type A cars during 2012 to 2016?

PINNACLE-2018 Main Exam 2nd Shift-EXERCISE
  1. When 7897, 8110 and 8536 are divided by the greatest number x, then th...

    Text Solution

    |

  2. In triangle ABC ,angle A=52^@and O is the orthocentre of the triangle ...

    Text Solution

    |

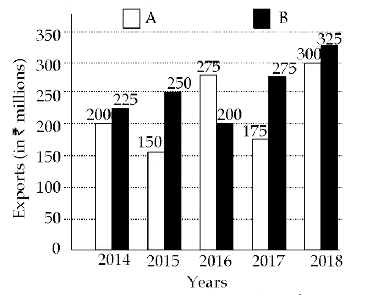
  3. The bar graph shows the exports of Cars of Type A and B In which ...

    Text Solution

    |

  4. Chord AB of a circle is produced to a point P, and C is a point on the...

    Text Solution

    |

  5. The value of ((cos 9^@+sin81^@)(sec9^@+ cosec81^@))/(sin56^@ sec34^@+c...

    Text Solution

    |

  6. In a constituency, 55% of the total number of voters are males and the...

    Text Solution

    |

  7. In what ratio, sugar costing Rs 60 per kg be mixed with sugar costing ...

    Text Solution

    |

  8. When x is added to each of 2,3,30 and 35, then the numbers obtained in...

    Text Solution

    |

  9. If the diameter of the base of a cone is 42 cm and its curved surface ...

    Text Solution

    |

  10. If A is 28% more than B and C is 25% less than the sum of A and B, the...

    Text Solution

    |

  11. In a trapezium ABCD, DC || AB , AB = 12 cm and DC = 7.2 cm. What is th...

    Text Solution

    |

  12. A started a business with a capital of Rs. 54000 and admitted B and C ...

    Text Solution

    |

  13. If each interior angle of a regular polygon is (128 4/7)^@ , then what...

    Text Solution

    |

  14. The given pie chart shows the breakup of total number of the employees...

    Text Solution

    |

  15. If 5 sin theta-4 cos theta=0, 0^@ < theta<90^@, then the value of (5si...

    Text Solution

    |

  16. The number of students in a class is 75, out of which 33 1/3% are boy...

    Text Solution

    |

  17. A number is first increased by 16% and then increased by 14%. The numb...

    Text Solution

    |

  18. One year ago, the ratio of the age (in years) of A to that of B was 4:...

    Text Solution

    |

  19. The ratio of investment by A to that by B is a business is 14:15 and t...

    Text Solution

    |

  20. A right circular cylinder of maximum volume is cut out from a solid wo...

    Text Solution

    |