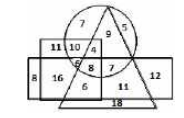
 How many male actors are painters but not artists?
 A
B
C
D
Text Solution
Verified by Experts


Topper's Solved these Questions
Similar Questions
Explore conceptually related problems
PINNACLE-VENN DIAGRAM-EXERCISE
- In the following diagram the triangle represents ‘rich’, the circle re...
Text Solution
|
- In the following diagram, the triangle represents ‘actors’, the circle...
Text Solution
|
- In the following diagram, the triangle represents ‘actors’, the circle...
Text Solution
|
- In the following diagram, the triangle represents ‘rich’, the circle r...
Text Solution
|
- In the following diagram, the triangle represents ‘cricket players’, t...
Text Solution
|
- In the following diagram, the triangle represents ‘army men’, the circ...
Text Solution
|
- In the following diagram, the triangle represents ‘women’, the circle ...
Text Solution
|
- In the following diagram, the triangle represents ‘cricket players’, t...
Text Solution
|
- In the following diagram, the triangle represents ‘teachers’, the circ...
Text Solution
|
- In the following diagram, the triangle represent ‘businessmen, the cir...
Text Solution
|
- Choose the venn diagram from the given options that best represents th...
Text Solution
|
- Choose the venn diagram from the given options that best represents th...
Text Solution
|
- Choose the venn diagram from the given options that best represents th...
Text Solution
|
- Choose the venn diagram from the given options that best represents th...
Text Solution
|
- Draw the venn diagram that best represents the relationship amongst th...
Text Solution
|
- Draw the venn diagram that best represents the relationship amongst th...
Text Solution
|
- Draw the venn diagram that best represents the relationship amongst th...
Text Solution
|
- Draw the venn diagram that best represents the relationship amongst th...
Text Solution
|
- Choose the venn diagram from the given options that best represents th...
Text Solution
|
- Draw the venn diagram that best represents the relationship amongst th...
Text Solution
|