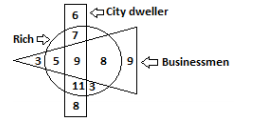
 How many rich city dwellers are not businessmen?
 A
B
C
D
Text Solution
Verified by Experts


PINNACLE-VENN DIAGRAM-EXERCISE
- In the following diagram, the triangle represents ‘cricket players’, t...
Text Solution
|
- In the following diagram, the triangle represents ‘teachers’, the circ...
Text Solution
|
- In the following diagram, the triangle represent ‘businessmen, the cir...
Text Solution
|
- Choose the venn diagram from the given options that best represents th...
Text Solution
|
- Choose the venn diagram from the given options that best represents th...
Text Solution
|
- Choose the venn diagram from the given options that best represents th...
Text Solution
|
- Choose the venn diagram from the given options that best represents th...
Text Solution
|
- Draw the venn diagram that best represents the relationship amongst th...
Text Solution
|
- Draw the venn diagram that best represents the relationship amongst th...
Text Solution
|
- Draw the venn diagram that best represents the relationship amongst th...
Text Solution
|
- Draw the venn diagram that best represents the relationship amongst th...
Text Solution
|
- Choose the venn diagram from the given options that best represents th...
Text Solution
|
- Draw the venn diagram that best represents the relationship amongst th...
Text Solution
|
- Choose the venn diagram from the given options that best represents th...
Text Solution
|
- Choose the venn diagram from the given options that best represents th...
Text Solution
|
- Select the venn diagram that represents the correct relationship betwe...
Text Solution
|
- Draw the venn diagram that best represents the relationship amongst th...
Text Solution
|
- Select the venn diagram that represents the correct relationship betwe...
Text Solution
|
- Select the venn diagram that represents the corret relationship betwee...
Text Solution
|
- Select the venn diagram that represents the correct relationship betwe...
Text Solution
|