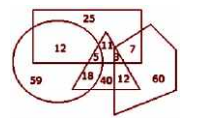
 How many of the employees are MBAs, and how many male MBAs are computer experts but NOT engineers, respectively ?
 A
B
C
D
Text Solution
Verified by Experts


PINNACLE-VENN DIAGRAM-EXERCISE
- A prestigious company had called for candidates to be interviewed. The...
Text Solution
|
- Draw the venn diagram that best represents the relationship amongst th...
Text Solution
|
- The data of a company’s employees is shown by the given Venn diagram. ...
Text Solution
|
- Select the Venn diagram that represents the correct relationship betwe...
Text Solution
|
- Draw the venn diagram that best represents the relationship amongst th...
Text Solution
|
- Draw the venn diagram that best represents the relationship amongst th...
Text Solution
|
- There are 70 students in a class, of them 50 students like cricket, 35...
Text Solution
|
- Select the Venn diagram that represents the correct relationship betwe...
Text Solution
|
- The given Venn diagram represents employees in an organisation The tri...
Text Solution
|
- The given Venn diagram represents employees in an organisation The tri...
Text Solution
|
- Draw the venn diagram that best represents the relationship amongst th...
Text Solution
|
- The given Venn diagram represents artists in a circus: The triangle re...
Text Solution
|
- In the given Venn diagram ‘Group A’ represents those who can speak ‘En...
Text Solution
|
- In the given Venn diagram, the ‘rectangle’ represents ‘engineers’, the...
Text Solution
|
- In the given Venn diagram, the triangle represents student playing tab...
Text Solution
|
- Draw the Venn diagram that best represents the relationship between th...
Text Solution
|
- Draw the Venn diagram that best represents the relationship between th...
Text Solution
|
- In the given Venn diagram, the ‘rectangle’ represents ‘travellers who ...
Text Solution
|
- Which of the following sets is best represented by the given Venn diag...
Text Solution
|
- Draw of the Venn diagrams best represents the relationship between the...
Text Solution
|