Home
Class 14
REASONING
In the given Venn diagram ‘Group A’ repr...

In the given Venn diagram ‘Group A’ represents those who can speak ‘English’, ‘Group B’ represents those who can speak ‘Hindi’, and ‘Group C’ represents those who can speak ‘Marathi’. The numbers given in the diagram represent the number of persons in that particular category. /
दिए गए वेन आरेख में, 'समूह A उन्हें दर्शाता है जो “अंग्रेजी' बोल सकते हैं | समूह B उन्हें दर्शाता है जो (हिंदी! बोल सकते हैं तथा समूह C उन्हें दर्शाता है जो 'मराठी' बोल सकते हैं | आरेख में दी गयी संख्याएँ उस विशेष श्रेणी में लोगों की संख्या को दर्शाती हैं|
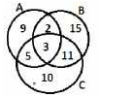
How many persons can speak exactly two languages?
कितने व्यक्ति केवल दो भाषाएँ बोल सकते हैं?

A

18

B

3

C

21

D

12

Text Solution

Verified by Experts

Promotional Banner

Topper's Solved these Questions

  • STATEMENTS AND CONCLUSION

    PINNACLE|Exercise EXERCISE|224 Videos
  • WEEKS AND DAYS

    PINNACLE|Exercise Exercise|15 Videos

Similar Questions

Explore conceptually related problems

In the given Venn diagram, the circle represents businessmen', the triangle represents 'landlords and the rectangle represents 'income tax payers. The numbers given in the diagram represent the number of persons in that particular category. How many businessmen are tax payers but NOT landlords?

In the given Venn diagram, the ‘rectangle’ represents ‘engineers’, the ‘circle’ represents ‘managers’, and the ‘triangle’ represents ‘married’. The numbers given the diagram represent the number of persons in that particular category. How many people are married but NOT engineers? दिए गए वेन आरेख में, आयत “इंजीनियरों' को दर्शाता है, वृत्त 'प्रबंधकों' को दर्शाता है तथा त्रिभुज "विवाहित लोगों' को दर्शाता है | आरेख में दी गयी संख्याएँ उस विशेष श्रेणी में मौजूद लोगों की संख्या बताती हैं | कितने लोग विवाहित हैं लेकिन इंजीनियर नहीं हैं ?

In the given Venn diagram, the hexagon represents 'farmers', the circle represents 'beneficiaries' and the square represents 'land-owners'. The numbers given in the diagram represent the number of persons in that particular category. दिए गये वेन आरेख में, षट्भुज “किसानों' को दर्शाता है, वृत्त “लाभार्थियों' को दर्शाता है तथा वर्ग 'भू-स्वामियों' को दर्शाता है | आरेख में दी गयी संख्याएँ उस विशेष श्रेणी में लोगों की संख्या के बारे में बताती हैं | How many farmers are both land-owners and beneficiaries? कितने किसान ऐसे हैं जो भू-स्वामी और लाभार्थी दोनों हैं ?

In the given Venn diagram, the pentagon represents ‘cricketers’, the square represents ‘Chess players’ and the circle represents ‘Clerks’. The numbers given in the diagram represent the number of persons in that particular category. दिए गए वेन आरेख में, पंचभुज “क्रिकेटरों' को दर्शाता है, वर्ग “शतरंज खिलाड़ियों” को दर्शाता है तथा वृत्त 'लिपिकों? का प्रतिनिधित्व करता है | आरेख में दी गयी संख्याएँ उस विशेष श्रेणी में लोगों की संख्या के बरे में बताती हैं | How many cricketers are chess players but NOT clerks? कितने क्रिकेटर शतरंज खिलाड़ी तो हैं लेकिन लिपिक नहीं ?

The given Venn diagram represents employees in an organisation The triangle represents executives, the circle represents females, the rectangle represents MBAs and the square represents technical staff. The numbers given in the diagram represent the number of persons in that particular category. दिया गए वेन आरेख किसी संगठन में कर्मचारियों को दर्शाता है | त्रिभुज कार्यकारियों को दर्शाता है, वृत्त महिलाओं के बारे में बताता है, आयत MBA करने वाले लोगों को दर्शाता है तथा वर्ग तकनीकी कर्मचारियों के बारे में बताता है | आरेख में दी गयी संख्याएँ उस विशेष श्रेणी में लोगों की संख्या को दर्शाती हैं | How many female executives are there in the organisation इस संगठन में कितने कार्यकारी हैं ?

PINNACLE-VENN DIAGRAM-EXERCISE
  1. Draw the venn diagram that best represents the relationship amongst th...

    Text Solution

    |

  2. The given Venn diagram represents artists in a circus: The triangle re...

    Text Solution

    |

  3. In the given Venn diagram ‘Group A’ represents those who can speak ‘En...

    Text Solution

    |

  4. In the given Venn diagram, the ‘rectangle’ represents ‘engineers’, the...

    Text Solution

    |

  5. In the given Venn diagram, the triangle represents student playing tab...

    Text Solution

    |

  6. Draw the Venn diagram that best represents the relationship between th...

    Text Solution

    |

  7. Draw the Venn diagram that best represents the relationship between th...

    Text Solution

    |

  8. In the given Venn diagram, the ‘rectangle’ represents ‘travellers who ...

    Text Solution

    |

  9. Which of the following sets is best represented by the given Venn diag...

    Text Solution

    |

  10. Draw of the Venn diagrams best represents the relationship between the...

    Text Solution

    |

  11. The given Venn diagram represents results of a class students: The t...

    Text Solution

    |

  12. Draw the Venn diagram that best represents the relationship between th...

    Text Solution

    |

  13. In the given Venn Diagram, the ‘rectangle’ represents ‘ladies of a clu...

    Text Solution

    |

  14. Draw the Venn diagrams that best represents the relationship between t...

    Text Solution

    |

  15. Which of the following Venn diagrams best represents the relationship ...

    Text Solution

    |

  16. Draw the Venn diagram that best represents the relationship between th...

    Text Solution

    |

  17. In the given Venn diagram, A denotes mangoes, B denotes bananas, C den...

    Text Solution

    |

  18. In the given Venn diagram, circle A represents books, circle B represe...

    Text Solution

    |

  19. In the given Venn diagram, A likes milk, B likes bread and C likes mea...

    Text Solution

    |

  20. Study the following diagram and answer the given question. निम्नलिखि...

    Text Solution

    |