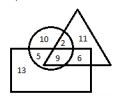
 How many travellers like to travel either by train or plane but NOT by bus?
 A
B
C
D
Text Solution
Verified by Experts


PINNACLE-VENN DIAGRAM-EXERCISE
- Draw the Venn diagram that best represents the relationship between th...
Text Solution
|
- Draw the Venn diagram that best represents the relationship between th...
Text Solution
|
- In the given Venn diagram, the ‘rectangle’ represents ‘travellers who ...
Text Solution
|
- Which of the following sets is best represented by the given Venn diag...
Text Solution
|
- Draw of the Venn diagrams best represents the relationship between the...
Text Solution
|
- The given Venn diagram represents results of a class students: The t...
Text Solution
|
- Draw the Venn diagram that best represents the relationship between th...
Text Solution
|
- In the given Venn Diagram, the ‘rectangle’ represents ‘ladies of a clu...
Text Solution
|
- Draw the Venn diagrams that best represents the relationship between t...
Text Solution
|
- Which of the following Venn diagrams best represents the relationship ...
Text Solution
|
- Draw the Venn diagram that best represents the relationship between th...
Text Solution
|
- In the given Venn diagram, A denotes mangoes, B denotes bananas, C den...
Text Solution
|
- In the given Venn diagram, circle A represents books, circle B represe...
Text Solution
|
- In the given Venn diagram, A likes milk, B likes bread and C likes mea...
Text Solution
|
- Study the following diagram and answer the given question. निम्नलिखि...
Text Solution
|
- Select the Venn diagram that best represents the relationship between ...
Text Solution
|
- Select the Venn diagram that best represents the relationship between ...
Text Solution
|
- In the given Venn diagram, 'A' denotes 'likes teaching', 'B' denotes '...
Text Solution
|
- In a batch of 68 students, 23 students do not participate in any of th...
Text Solution
|
- Select the Venn diagram that best represents the relationship between ...
Text Solution
|