Home
Class 14
REASONING
Study the following diagram. दी गयी आक...

Study the following diagram.
दी गयी आकृति के आधार पर पूछे गए प्रश्न का उत्तर दें |
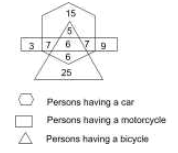
How many persons have only a motorcycle?
कितने लोगों के पास सिर्फ मोटरसाइकिल है ?

A

12

B

32

C

9

D

3

Text Solution

Verified by Experts

Promotional Banner

Topper's Solved these Questions

  • STATEMENTS AND CONCLUSION

    PINNACLE|Exercise EXERCISE|224 Videos
  • WEEKS AND DAYS

    PINNACLE|Exercise Exercise|15 Videos

Similar Questions

Explore conceptually related problems

Study the following diagram. How many persons have only motorcycle?

Study the information carefully and answer the question based on it./दी गई जानकारी को ध्यान से पढ़ें और इस पर आधारित प्रश्न का उत्तर How many persons like only Casio and Timex? /कितने व्यक्ति केवल कैसिओ और टाइमैक्स को पसंद करते हैं?

Study the following bar graph and answer the question given. निम्नलिखित दंड आरेख का अध्ययन करें तथा दिए गए प्रश्न का उत्तर दें | The total production of motorcycles of companies C, D and E is what percent less than the total demand of motorcycles of all the companies during five years? कंपनी C, D और E की मोटरसाइकिल का कुल उत्पादन पांच वर्षों के दौरान सभी कंपनियों की मोटरसाइकिलों की कुल मांग से कितना प्रतिशत कम है ?

Study the following bar graph and answer the question given. निम्नलिखित दंड आरेख का अध्ययन करें तथा दिए गए प्रश्न का उत्तर दें | The ratio of the total demand of motorcycles of companies A, C and E to the total production of motorcycles of B and C is: कंपनी A, C और E की मोटरसाइकिल की कुल मांग और B तथा C की मोटरसाइकिल के कुल उत्पादन के बीच अनुपात ज्ञात करें

Study the following bar graph and answer the question given. निम्नलिखित दंड आरेख का अध्ययन करें तथा दिए गए प्रश्न का उत्तर दें | The number of companies whose production of motorcycles is equal to or more than the average demand of motorcycles (per year) over five years is: ऐसी कंपनियों की संख्या कितनी है जिसका मोटरसाइकिल उत्पादन इन पांच वर्षों के दौरान मोटरसाइकिलों की औसत मांग (प्रति वर्ष ) से अधिक या बराबर रहा है ?

Study the graph and answer the questions based on the graph: आरेख का अध्ययन करें और आरेख के आधार पर प्रश्नों के उत्तर दें: On which day the production was 1/5 th of the total production? किस दिन उत्पादन कुल उत्पादन का 1/5 था?

Study the following graph and answer the questions based on the graph. आरेख का अध्ययन करें और आरेख के आधार पर प्रश्नों के उत्तर दें: What percentage of the total number of teachers are aged less than 45 years? कुल शिक्षकों में से कितने प्रतिशत 45 वर्ष से कम आयु के हैं?

The given table represents the production of different types of motorcycles (in thousands) over a period of six years. Study the table carefully and answer the questions that follows: दी गयी तालिका छः वर्षों की अवधि के दौरान अलग-अलग प्रकार की मोटर साइकिलों के उत्पादन ( हज़ार में ) को दर्शाती है | इस तालिका का ध्यानपूर्वक अध्ययन करें तथा फिर पूछे गए प्रश्नों का उत्तर दीजिए | By what percentage is the total production of type A motorcycles over six years, less than the total production of all types of motorcycles in 2013 and 2016? इन छः वर्षों में A प्रकार की मोटरसाइकिल का कुल उत्पादन 2013 तथा 2016 में सभी प्रकार की मोटर साइकिलों के कुल उत्पादन से कितना प्रतिशत कम रहा है ?

PINNACLE-VENN DIAGRAM-EXERCISE
  1. In the Venn diagram, different animals are represented by different ar...

    Text Solution

    |

  2. In the given Venn diagram, different areas denote different types of p...

    Text Solution

    |

  3. Study the following diagram. दी गयी आकृति के आधार पर पूछे गए प्रश्न ...

    Text Solution

    |

  4. Draw the venn diagram that best represents the relationship amongst th...

    Text Solution

    |

  5. Draw the venn diagram that best represents the relationship amongst th...

    Text Solution

    |

  6. Find the number of students who play any two of the three sports. कि...

    Text Solution

    |

  7. Select the Venn diagram that best represents the relationship between ...

    Text Solution

    |

  8. In the Venn diagram given below, the 'circle' represents 'boys', the '...

    Text Solution

    |

  9. Select the Venn diagram that best represents the relationship between ...

    Text Solution

    |

  10. Study the given Venn diagram carefully and answer the following questi...

    Text Solution

    |

  11. Draw the venn diagram that best represents the relationship amongst th...

    Text Solution

    |

  12. Select the Venn diagram that best illustrates the relationship between...

    Text Solution

    |

  13. Select the Venn diagram that best illustrates the relationship between...

    Text Solution

    |

  14. In the given Venn diagram the 'Triangle' represents 'females', 'Circle...

    Text Solution

    |

  15. Select the correct option that represents the given Venn diagram निम...

    Text Solution

    |

  16. The given Venn diagram best represents the relationship between which ...

    Text Solution

    |

  17. In the following venn diagram, the ‘Circle’ stands for ‘Journalists’, ...

    Text Solution

    |

  18. Draw the Venn diagram that best illustrates the relationship between t...

    Text Solution

    |

  19. In the following Venn diagram the ‘Pentagon' stands for ‘Architects’, ...

    Text Solution

    |

  20. 0. Select the Venn diagram that best illustrates the relationship betw...

    Text Solution

    |