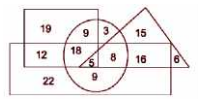
 How many female graduates who are
under 30 years are employed? /
How many female graduates who are
under 30 years are employed? /A
B
C
D
Text Solution
Verified by Experts


Topper's Solved these Questions
Similar Questions
Explore conceptually related problems
PINNACLE-VENN DIAGRAM-EXERCISE
- In the Venn diagram given below, the 'circle' represents 'boys', the '...
Text Solution
|
- Select the Venn diagram that best represents the relationship between ...
Text Solution
|
- Study the given Venn diagram carefully and answer the following questi...
Text Solution
|
- Draw the venn diagram that best represents the relationship amongst th...
Text Solution
|
- Select the Venn diagram that best illustrates the relationship between...
Text Solution
|
- Select the Venn diagram that best illustrates the relationship between...
Text Solution
|
- In the given Venn diagram the 'Triangle' represents 'females', 'Circle...
Text Solution
|
- Select the correct option that represents the given Venn diagram निम...
Text Solution
|
- The given Venn diagram best represents the relationship between which ...
Text Solution
|
- In the following venn diagram, the ‘Circle’ stands for ‘Journalists’, ...
Text Solution
|
- Draw the Venn diagram that best illustrates the relationship between t...
Text Solution
|
- In the following Venn diagram the ‘Pentagon' stands for ‘Architects’, ...
Text Solution
|
- 0. Select the Venn diagram that best illustrates the relationship betw...
Text Solution
|
- In the following Venn diagram, the ‘Circle’ stands for ‘Lawyers’, the ...
Text Solution
|
- Select the Venn diagram that best illustrates the relationship between...
Text Solution
|
- In the following Venn diagram, the ‘Rectangle’ stands for ‘Judges’ the...
Text Solution
|
- Study the venn diagram that best illustrates the relationship between ...
Text Solution
|
- Study the venn diagram that best illustrates the relationship between ...
Text Solution
|
- Study the venn diagram that best illustrates the relationship between ...
Text Solution
|
- Study the venn diagram that best illustrates the relationship between ...
Text Solution
|