Text Solution
Verified by Experts


Topper's Solved these Questions
Similar Questions
Explore conceptually related problems
CENGAGE PUBLICATION-GRAPHICAL TRANSFORMATIONS-ILLUSTRATION
- Discuss the differentiability of f(x)=min.{|x|,|x-2|,2-|x-1|}.
Text Solution
|
- If the equation |x^2+b x+c|=k has four real roots, then a. b^2-4c > 0...
Text Solution
|
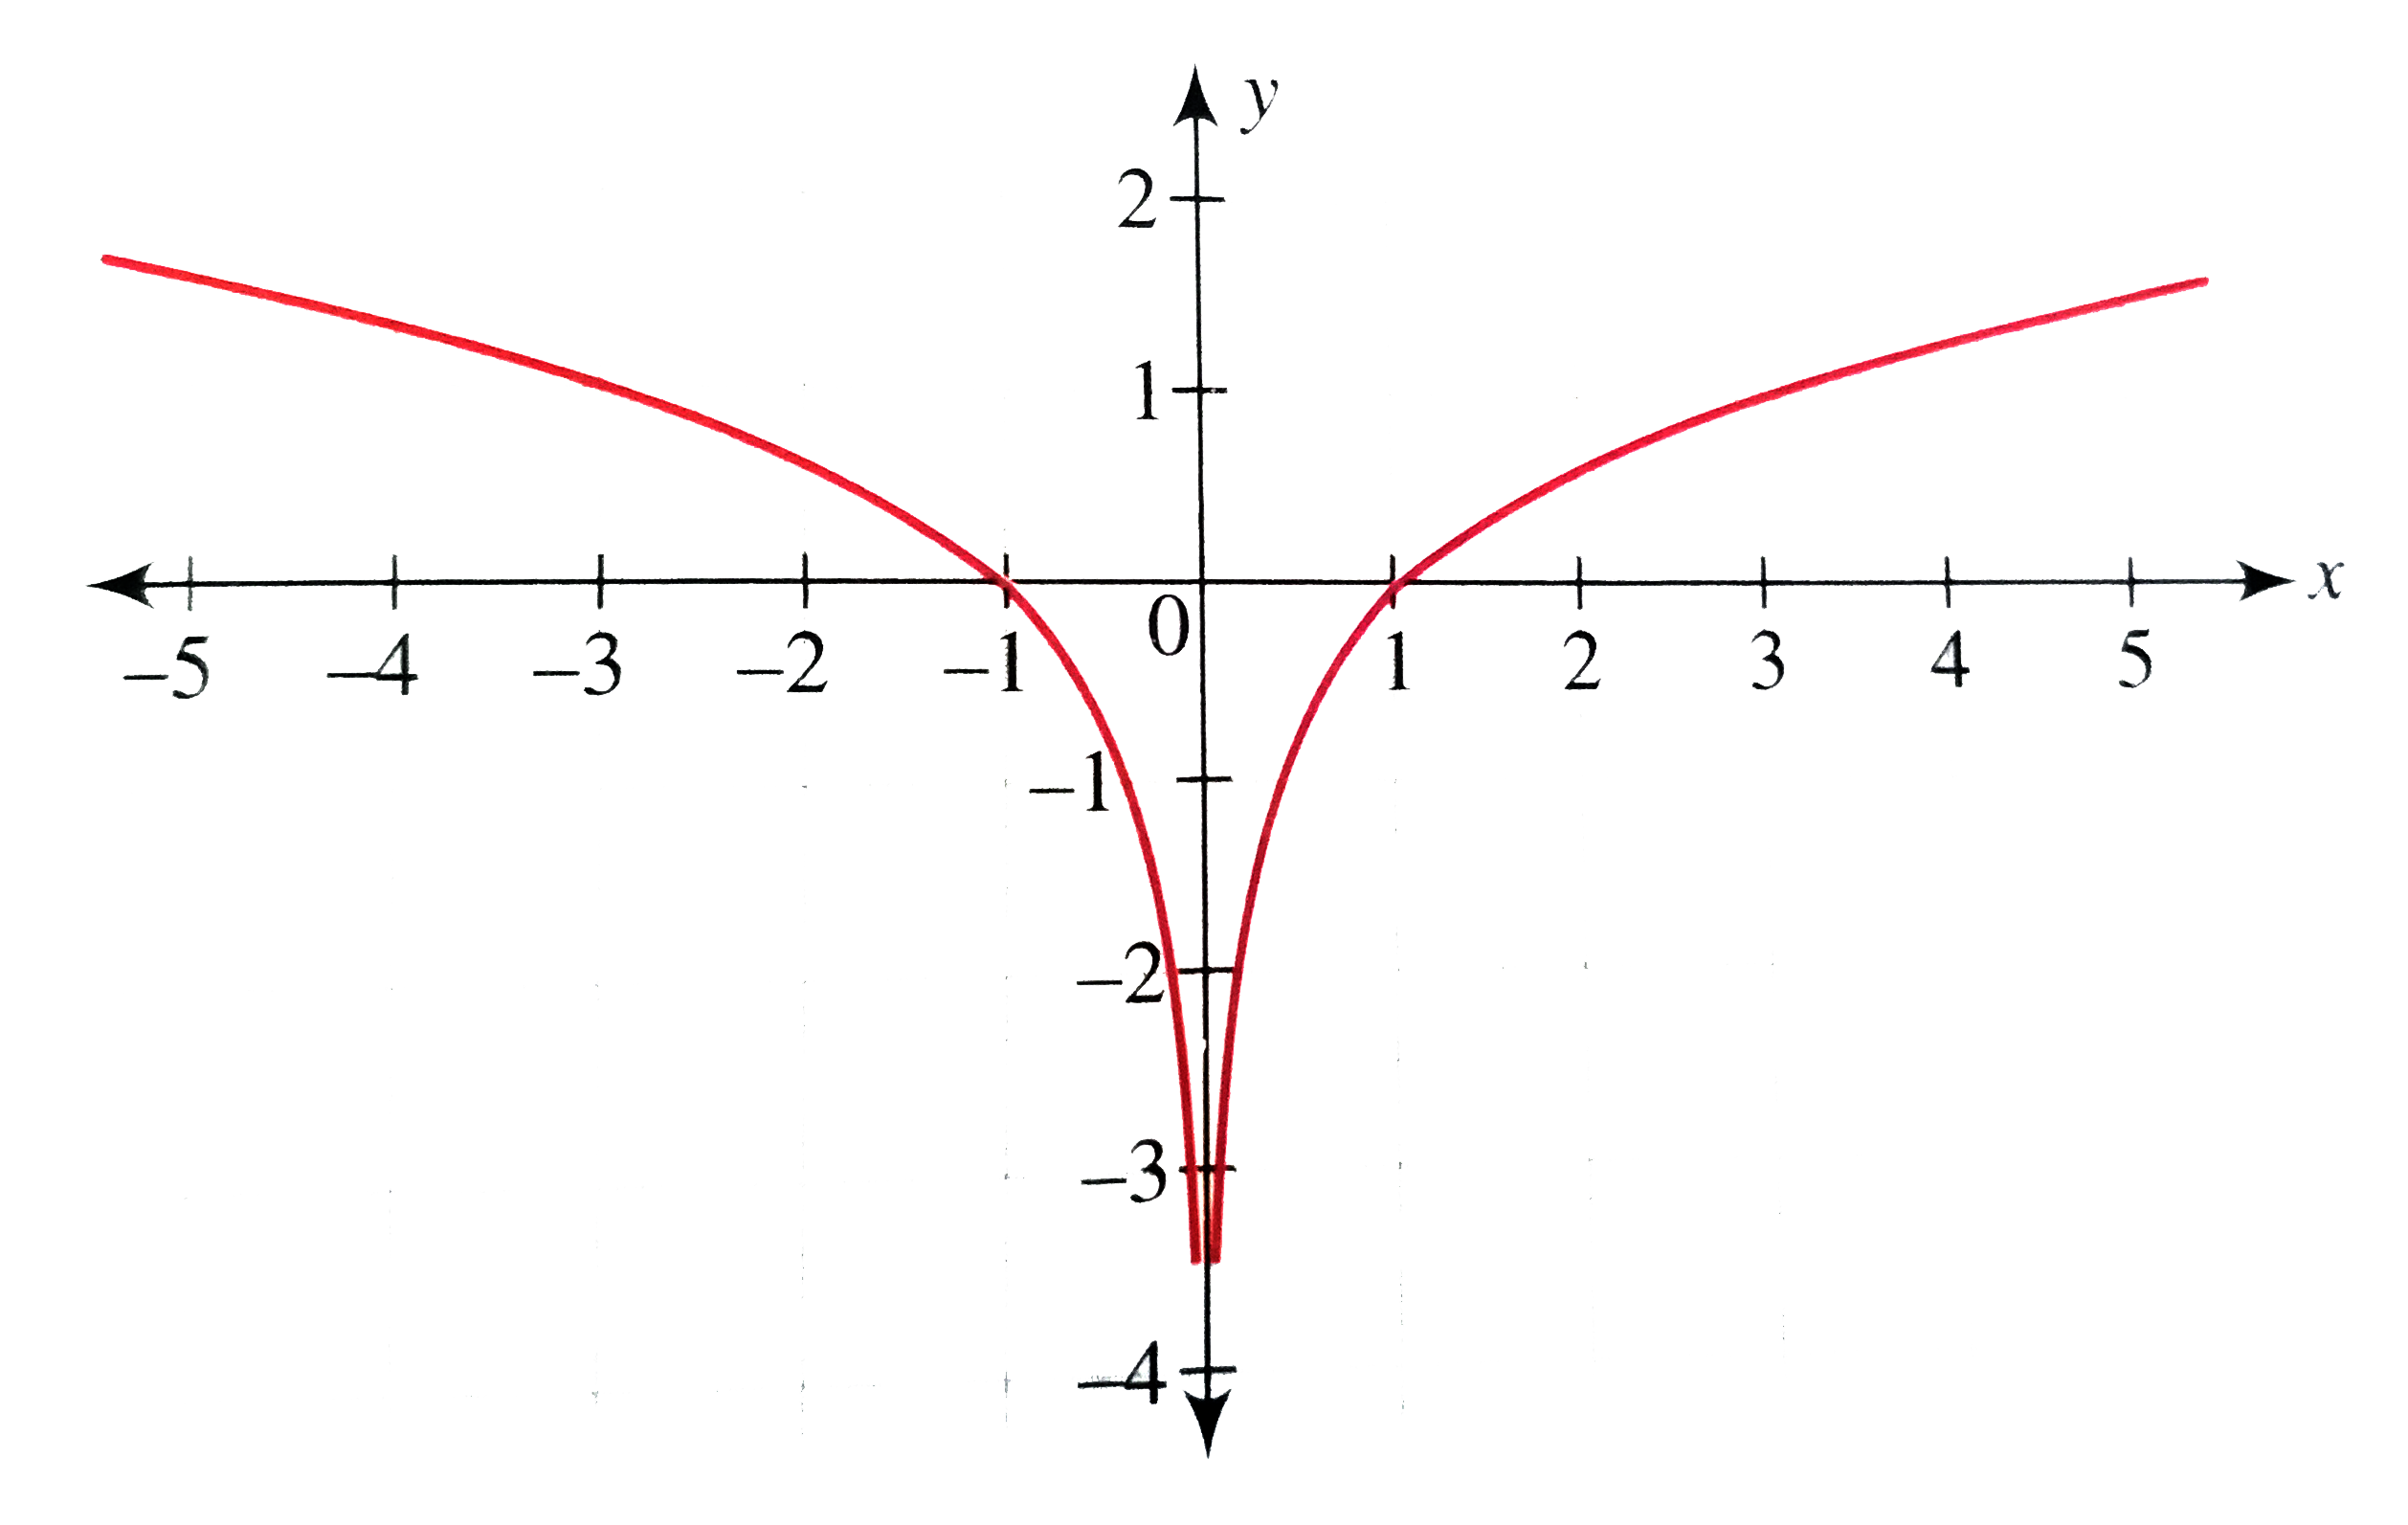
- Sketch the curve y="log"|x|
Text Solution
|
- Draw the graph of y=sin|x|.
Text Solution
|
- Draw the graph of y=[|x|], where [.] denotes the greatest integer func...
Text Solution
|
- Draw the graph of y=sin^(-1)|x|.
Text Solution
|
- Draw the graph of y=tan^(-1)|x|.
Text Solution
|
- Draw the graph of y={|x|}, where {.} represents the fractional part fu...
Text Solution
|
- If y = x^3-3x + 2, then draw the graph of y=|x^3-3x + 2|
Text Solution
|
- Draw the graph of y=|1-(1)/(|x|-2)|.
Text Solution
|
- Draw the graph of |y|=|2^|x|-3|.
Text Solution
|
- Find the total number of solutions of sinpix=|in|x||
Text Solution
|
- Find the number of solutions to 7^|x|(|1-|x||)=1.
Text Solution
|
- The graph of the function y=f(x) is shown. Find the number of sol...
Text Solution
|
- Consider the function f(x)=x^(2)+bx+c, where D=b^(2)-4cgt0, then match...
Text Solution
|
- Draw the graph of |y|=sinx.
Text Solution
|
- Draw the graph of |y|=tanx.
Text Solution
|
- Sketch the curve |y|=(x-1)(x-2)dot
Text Solution
|
- Draw the graph of |y|={x}, where {.} represents the fractional part fu...
Text Solution
|
- Draw the graph of |x|+|y|=1+x.
Text Solution
|