


CENGAGE PUBLICATION-GRAPHICAL TRANSFORMATIONS-ILLUSTRATION
- Draw the graph of |x|-|y|=2 using graphical transformation.
Text Solution
|
- Draw the graph of y=|2^(|x|)-3|.
Text Solution
|
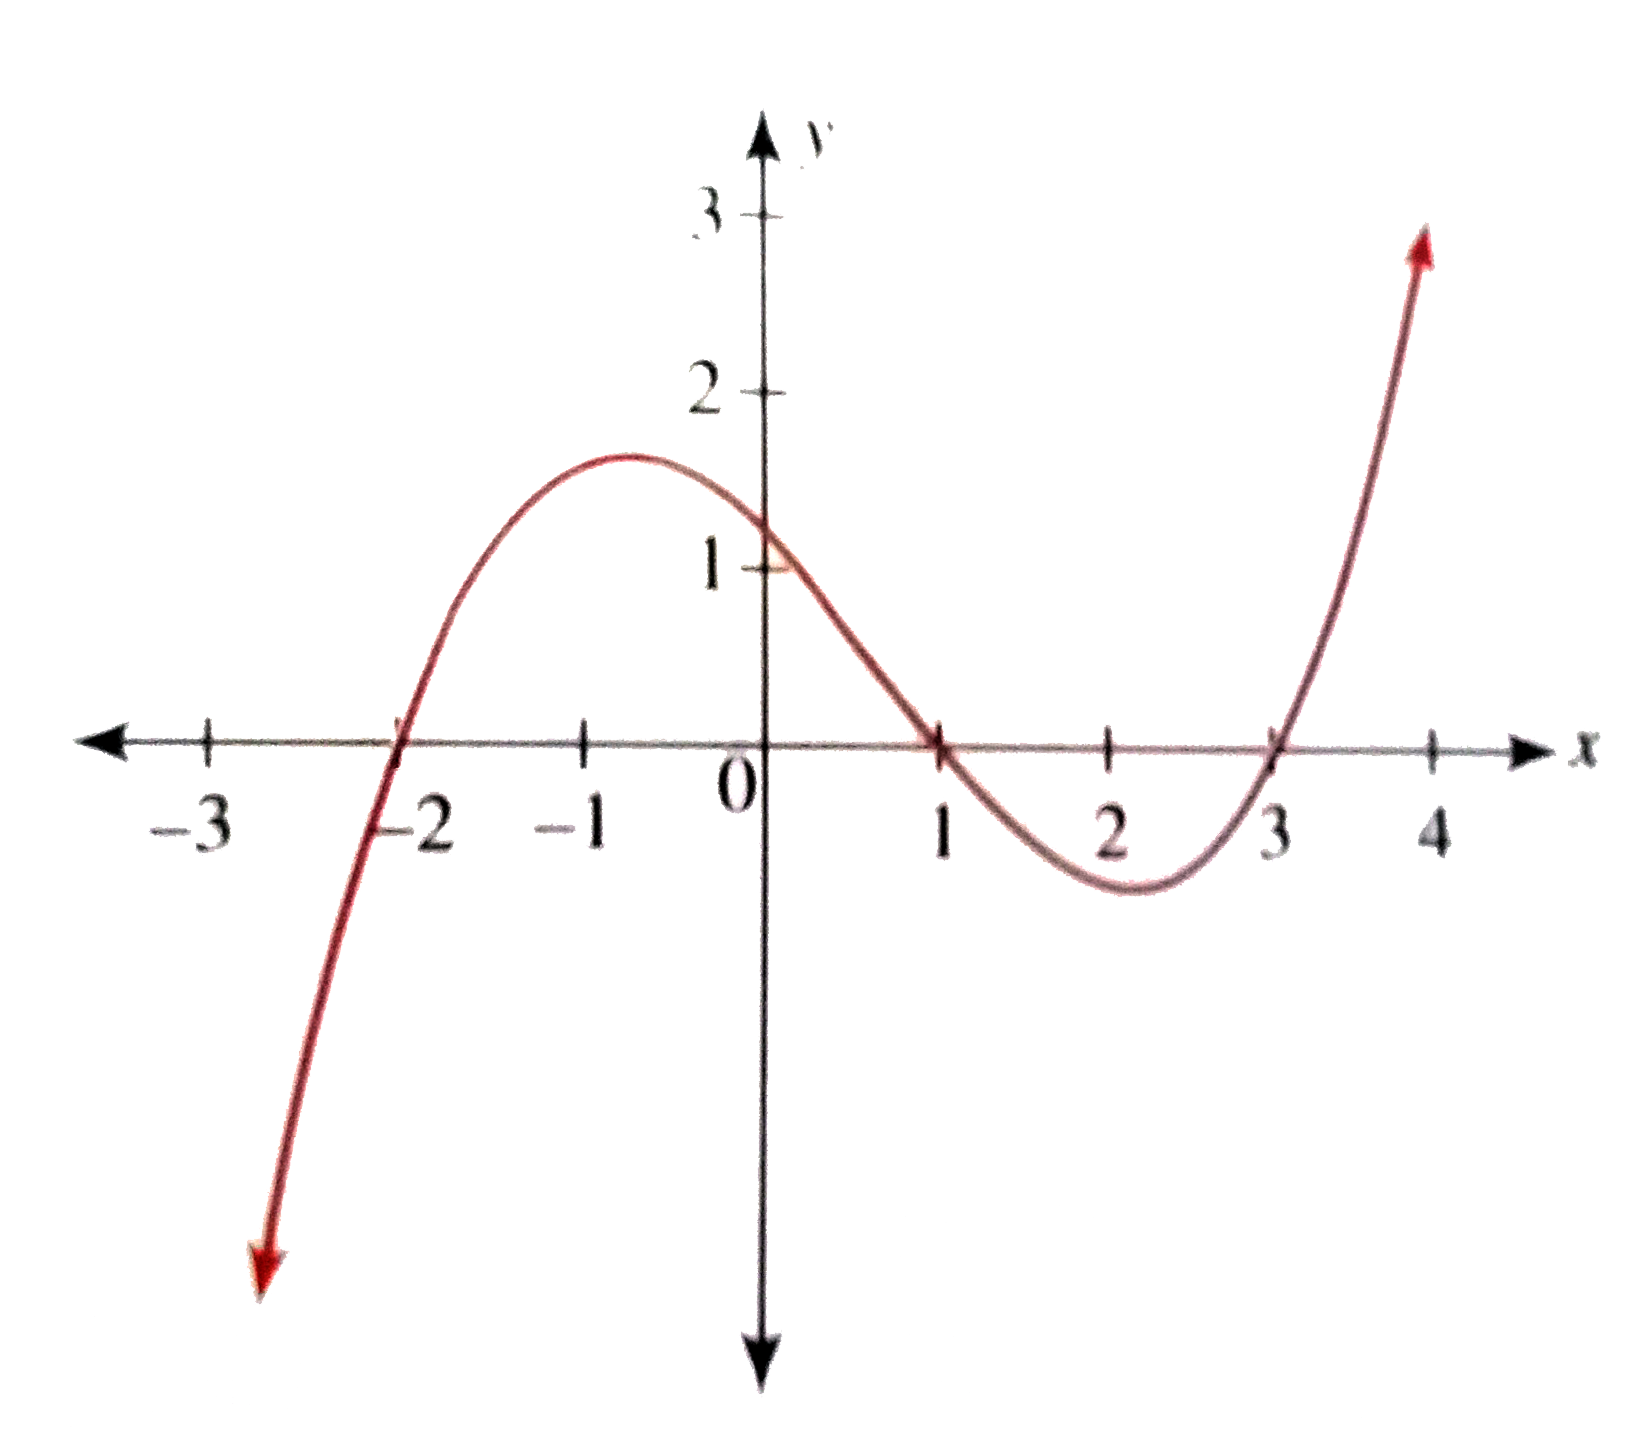
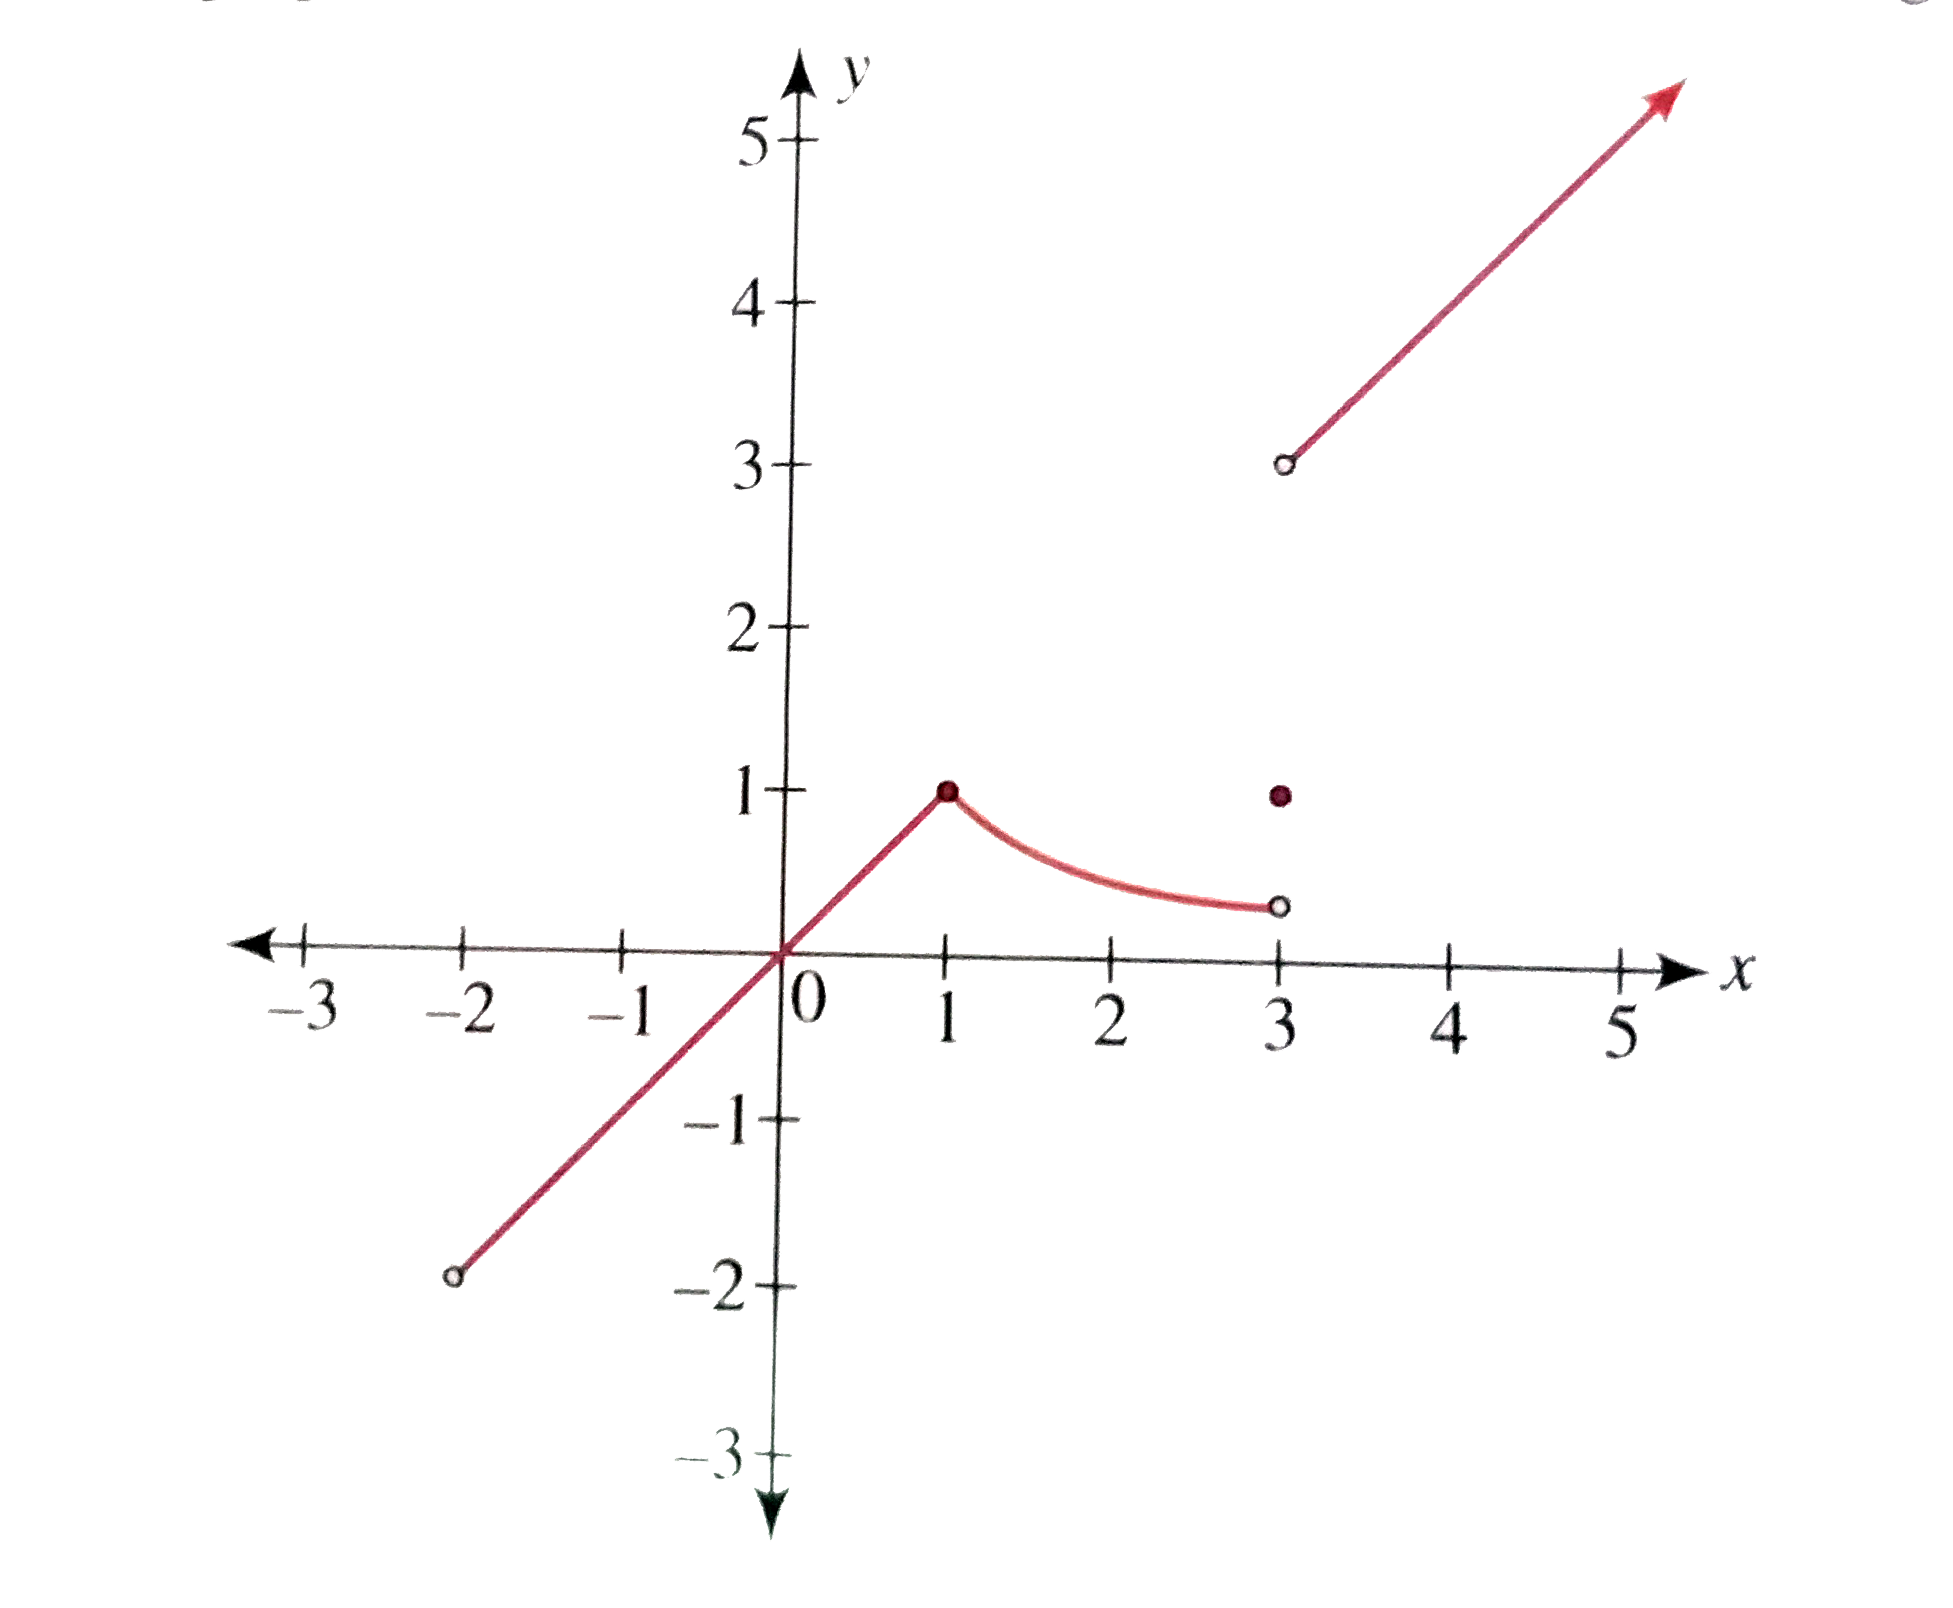
- The graph of the function y=f(x) is as shown in the figure. Then ...
Text Solution
|
- about to only mathematics
Text Solution
|
- Draw the graph and discuss the continuity of f(x)=[sinx+cosx],x in [0,...
Text Solution
|
- Draw the graph and find the points of discontinuity for f(x)=[x^(2)-x-...
Text Solution
|
- Draw the graph of y=tan^(-1)x+cot^(-1)x
Text Solution
|
- Draw the graph of y=|(1)/(|x|)-2|.
Text Solution
|
- Draw the graph of y=tan^(-1)x+cos^(-1)x+sin^(-1)x.
Text Solution
|
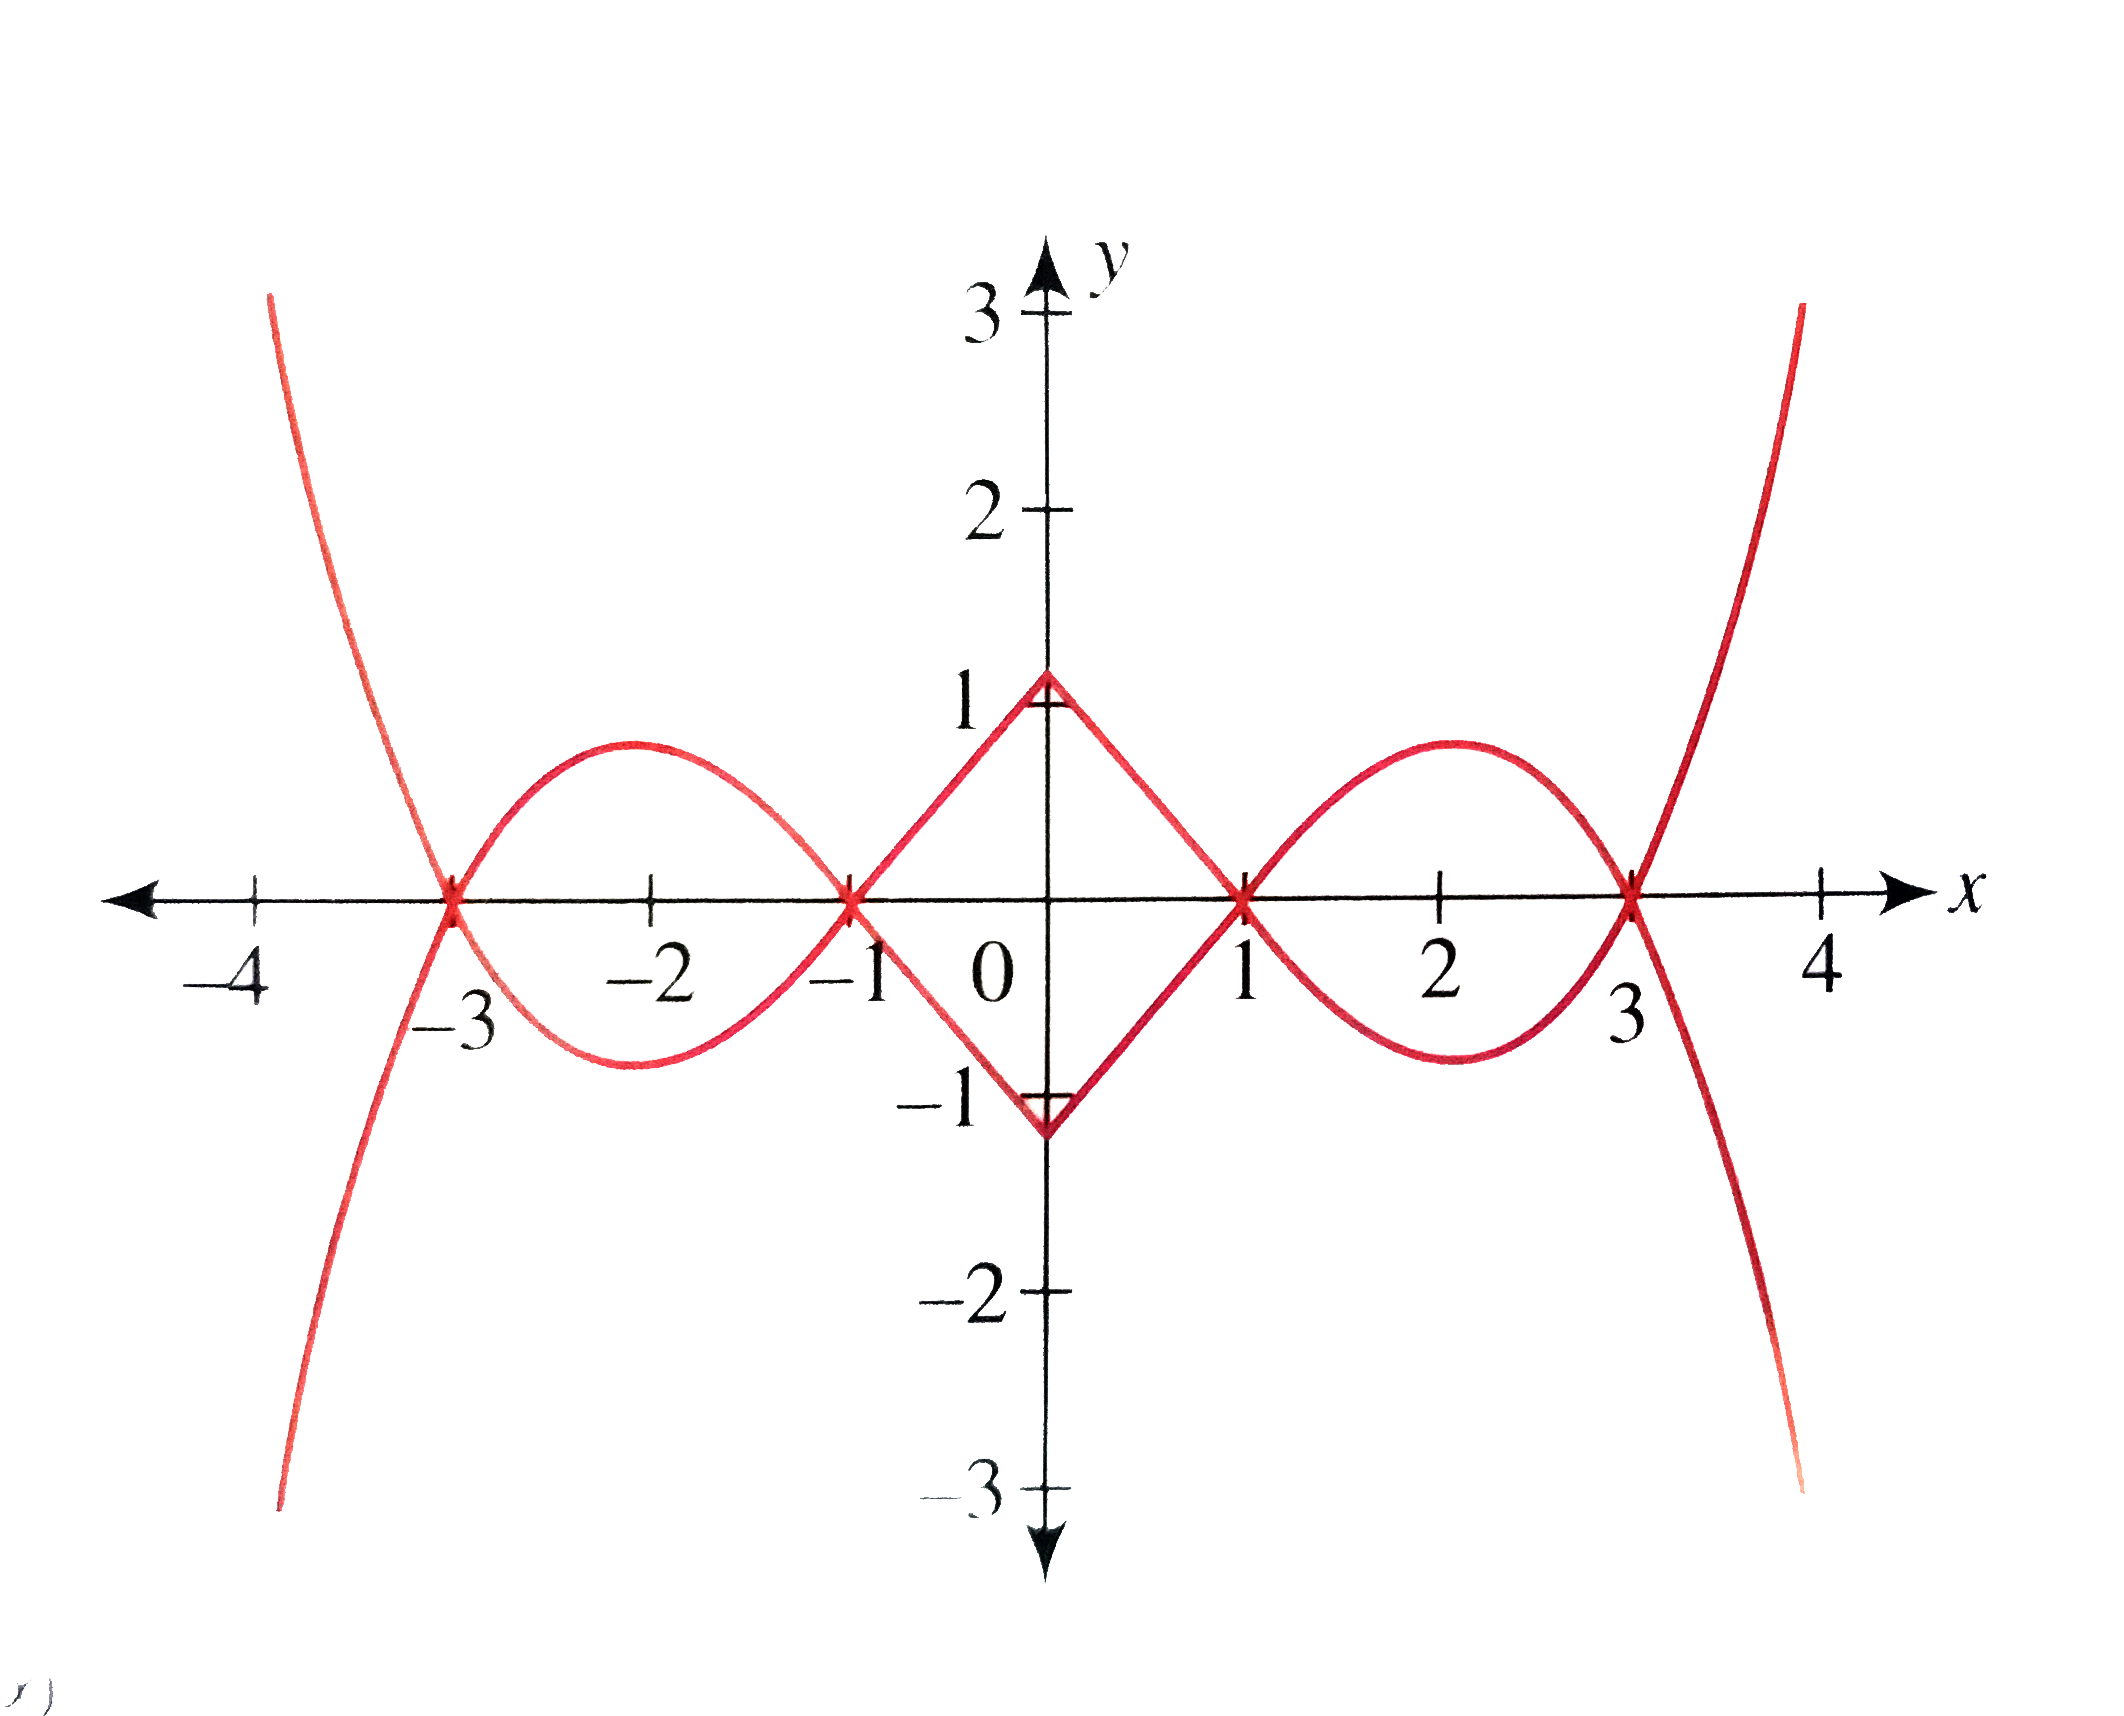
- Draw the graph of |y|=(x-1)(x-2)(x-3).
Text Solution
|
- Draw the graph of y=2sin^(-1)(x//3).
Text Solution
|
- Draw the graph of y=cot^(-1)(-x).
Text Solution
|
- Draw the graph of y=sec^(-1)|x|.
Text Solution
|
- Draw the graph of y=|log(e)(x+3)|.
Text Solution
|
- Draw the graph of y=|log(e)|x||.
Text Solution
|
- Draw the graph of y=|{x}-0.5|, where {.} represents the fractional par...
Text Solution
|
- Draw the graph of y=|sinx|+sin|x|.
Text Solution
|
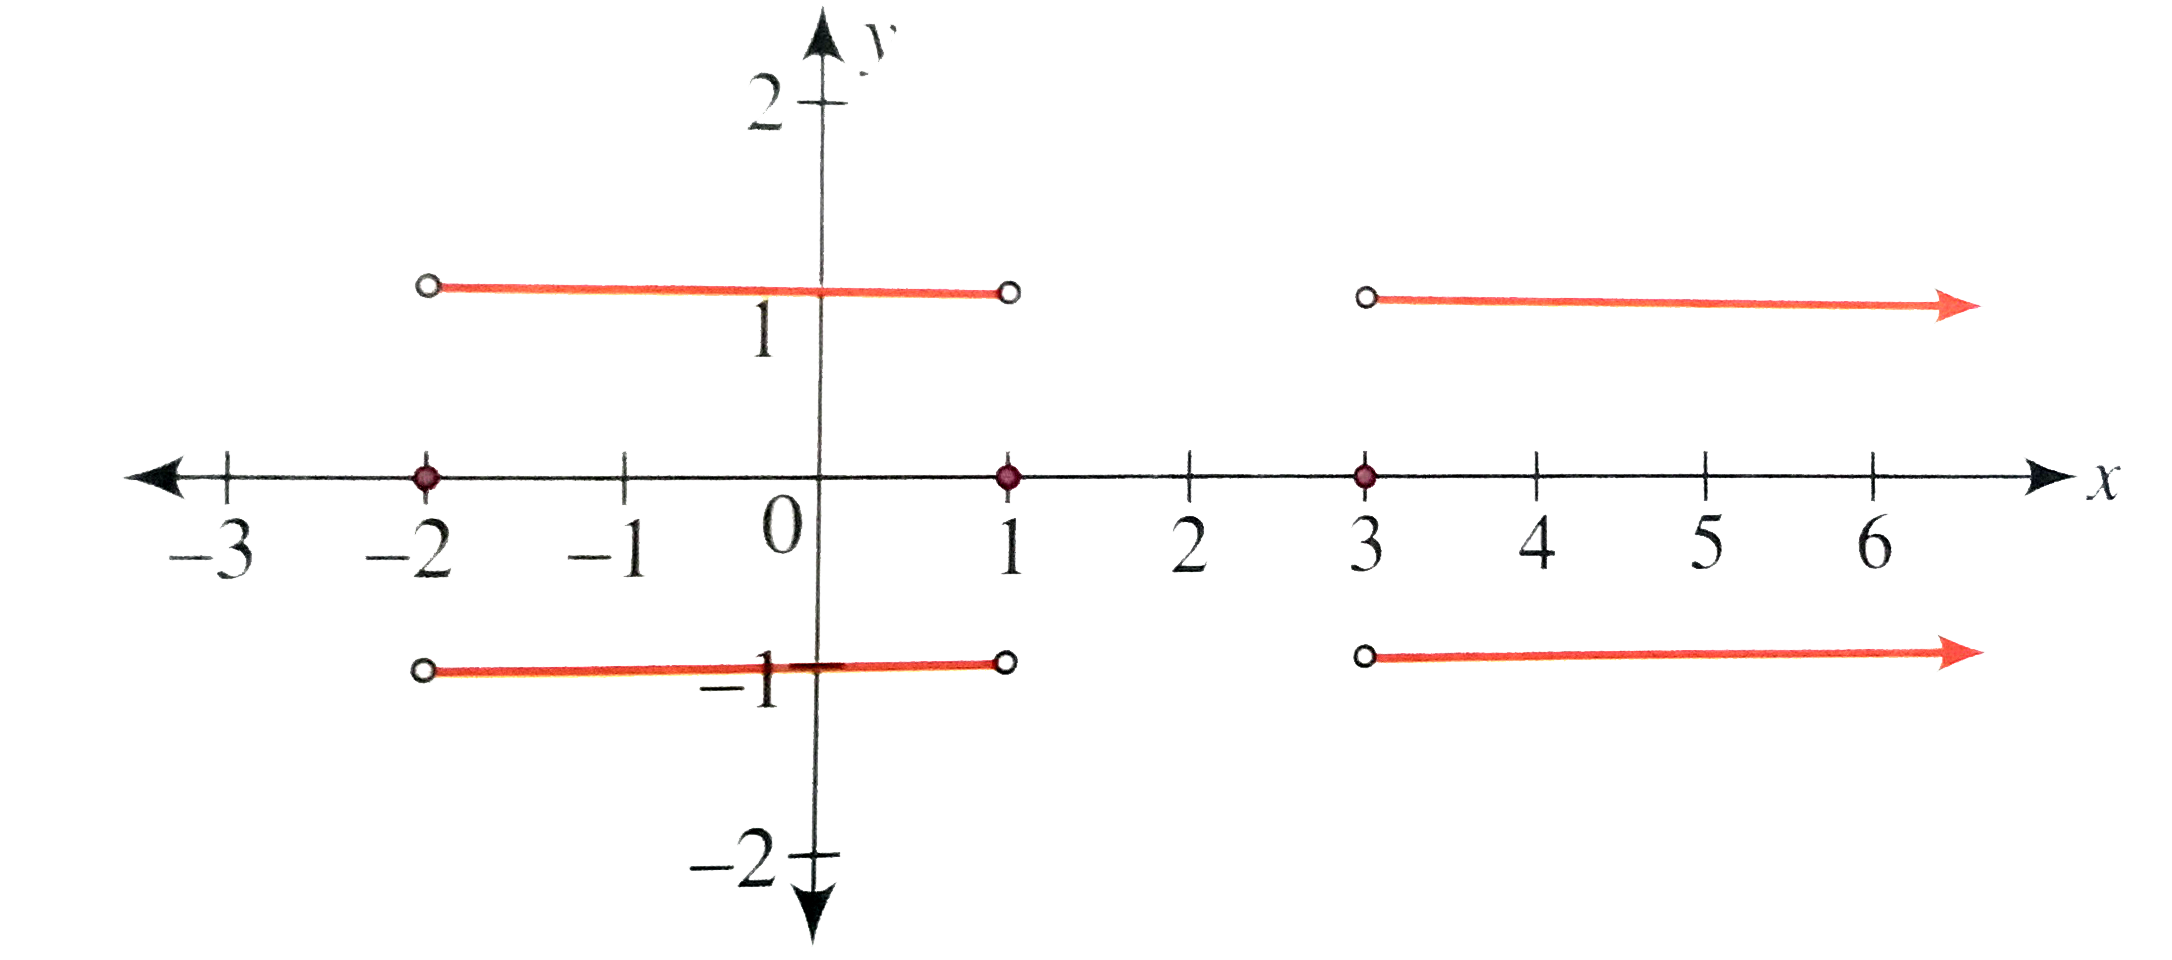
- If the graph of y=|f(x)| is as shown in figure then the graph of y=f(...
Text Solution
|
- The number of real solutions of the equation sqrt(1+cos2x)=sqrt(2)sin^...
Text Solution
|
- Find the number of real solutions to the equation log(0.5)|x|=2|x|.
Text Solution
|