Text Solution
Verified by Experts


Topper's Solved these Questions
Similar Questions
Explore conceptually related problems
CENGAGE PUBLICATION-GRAPHS OF POLYNOMIAL AND RATIONAL FUNCTIONS-Exercises
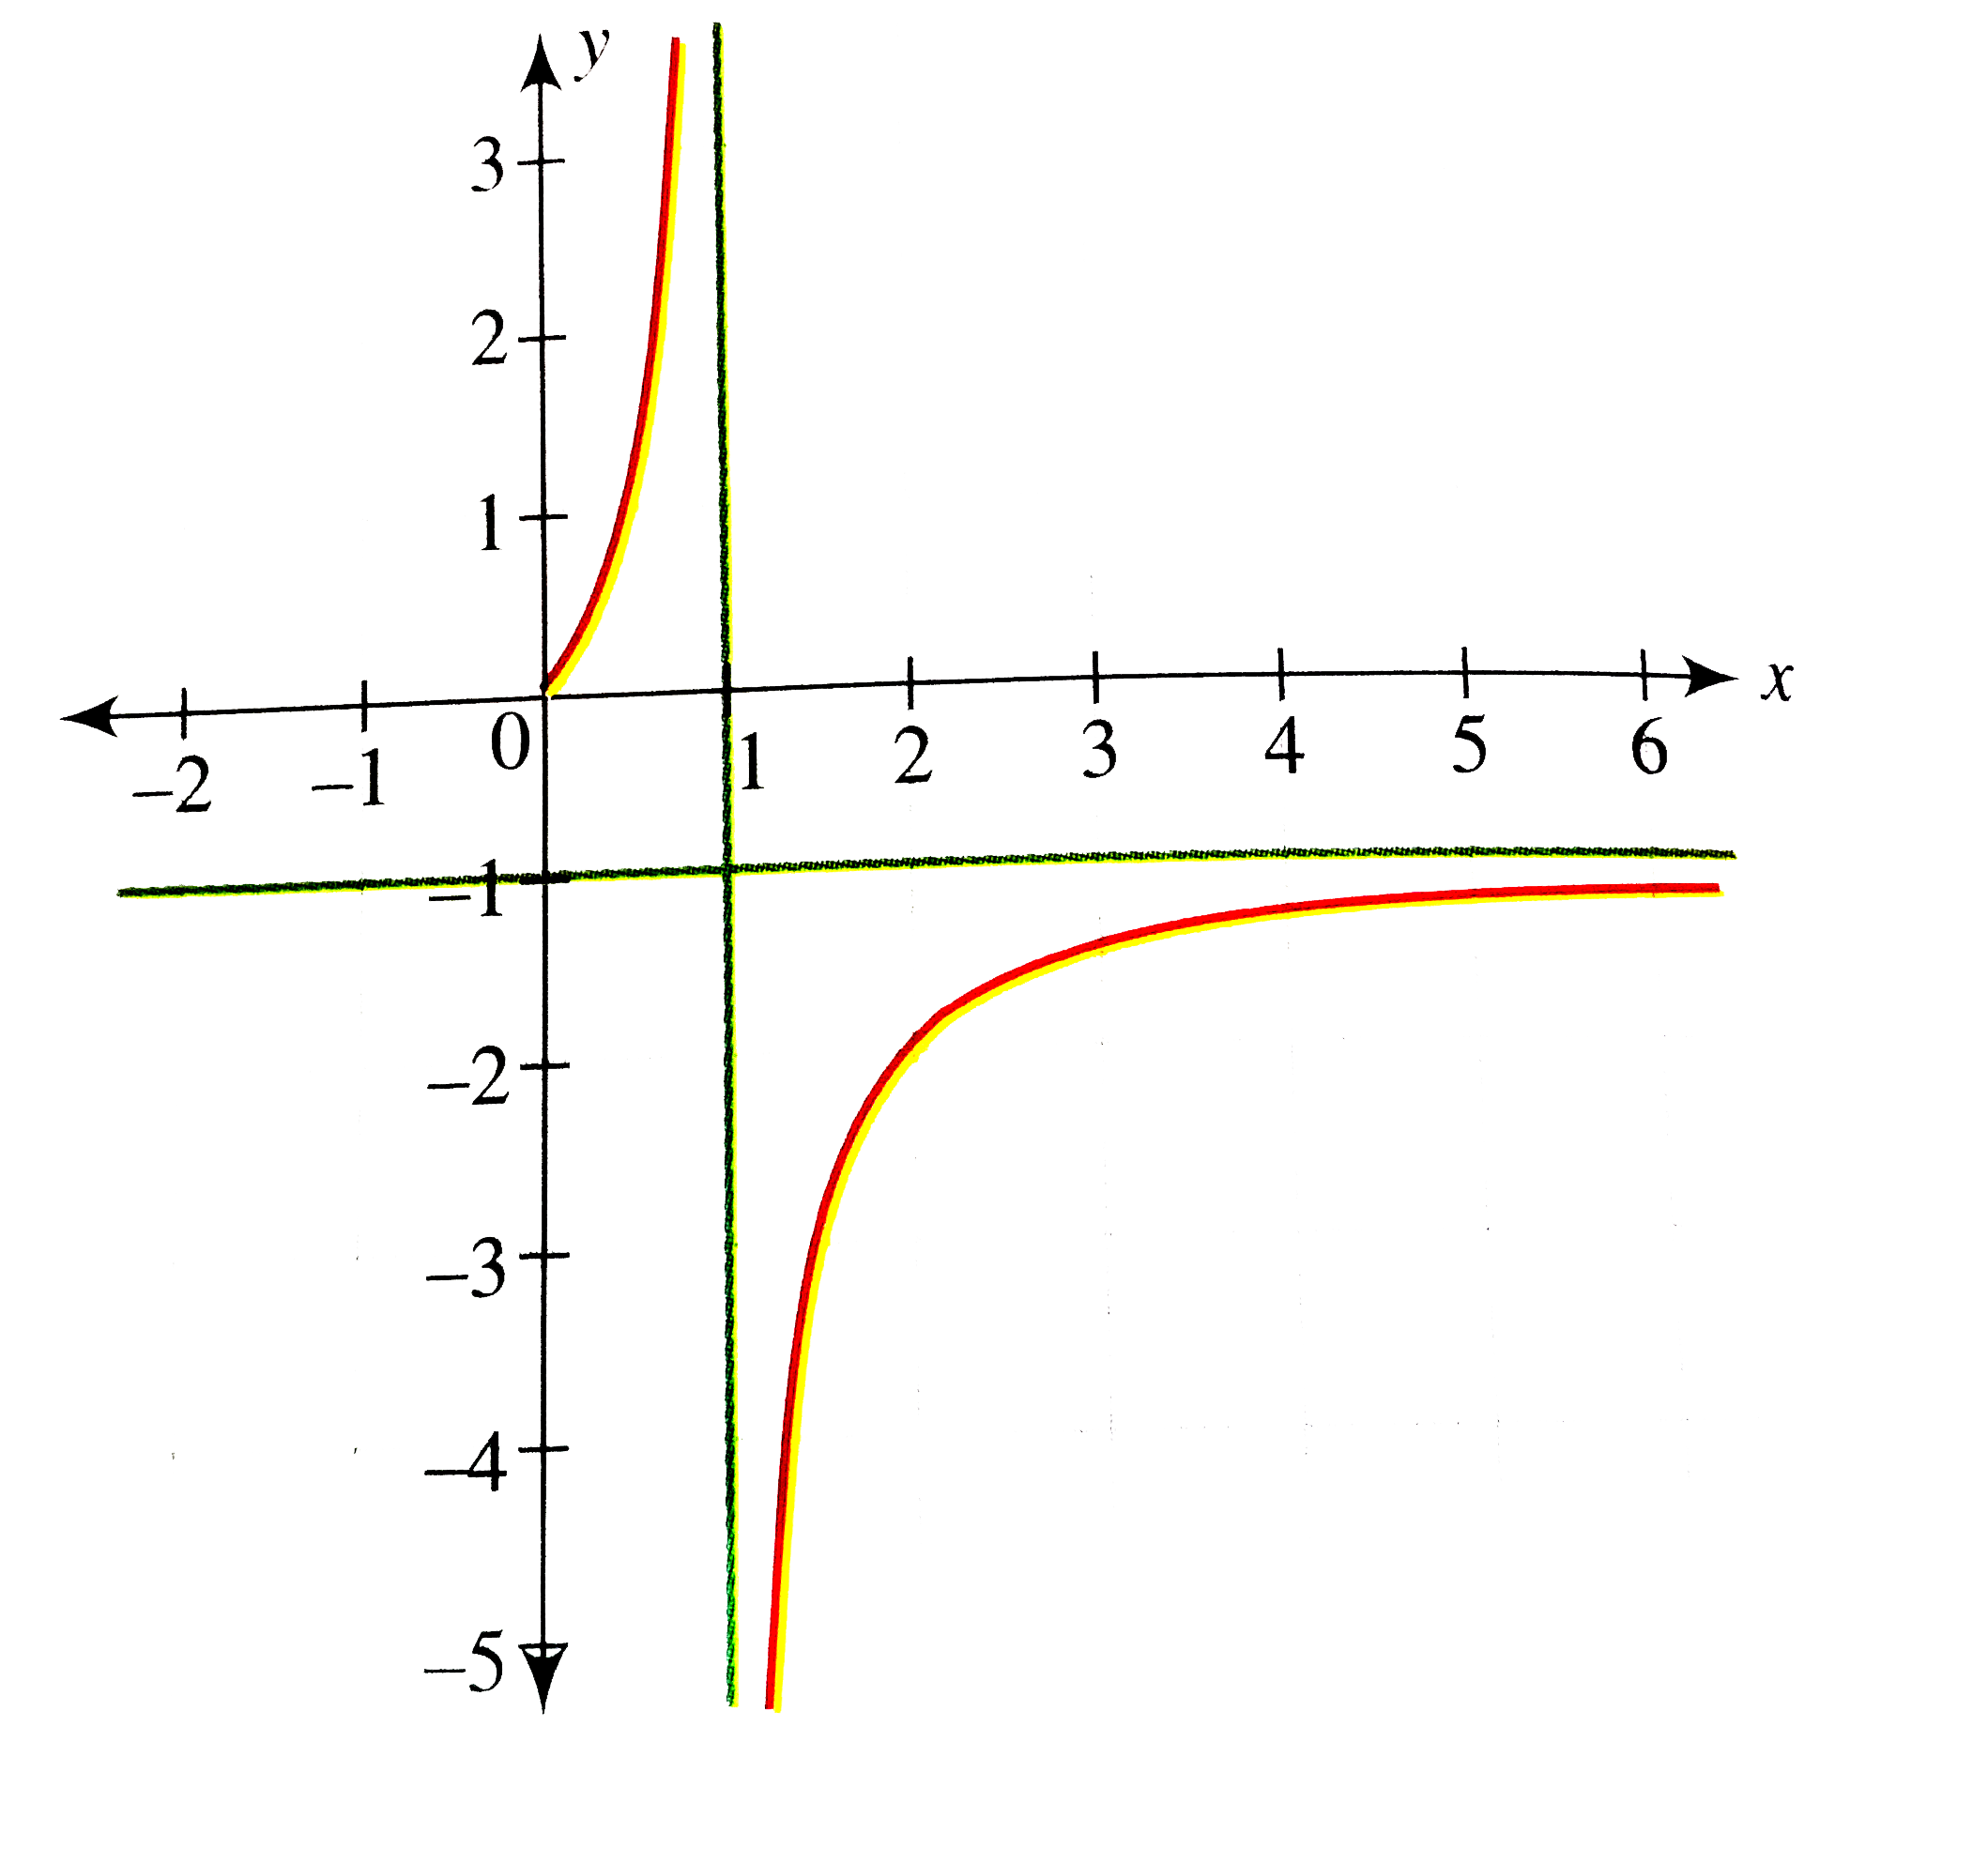
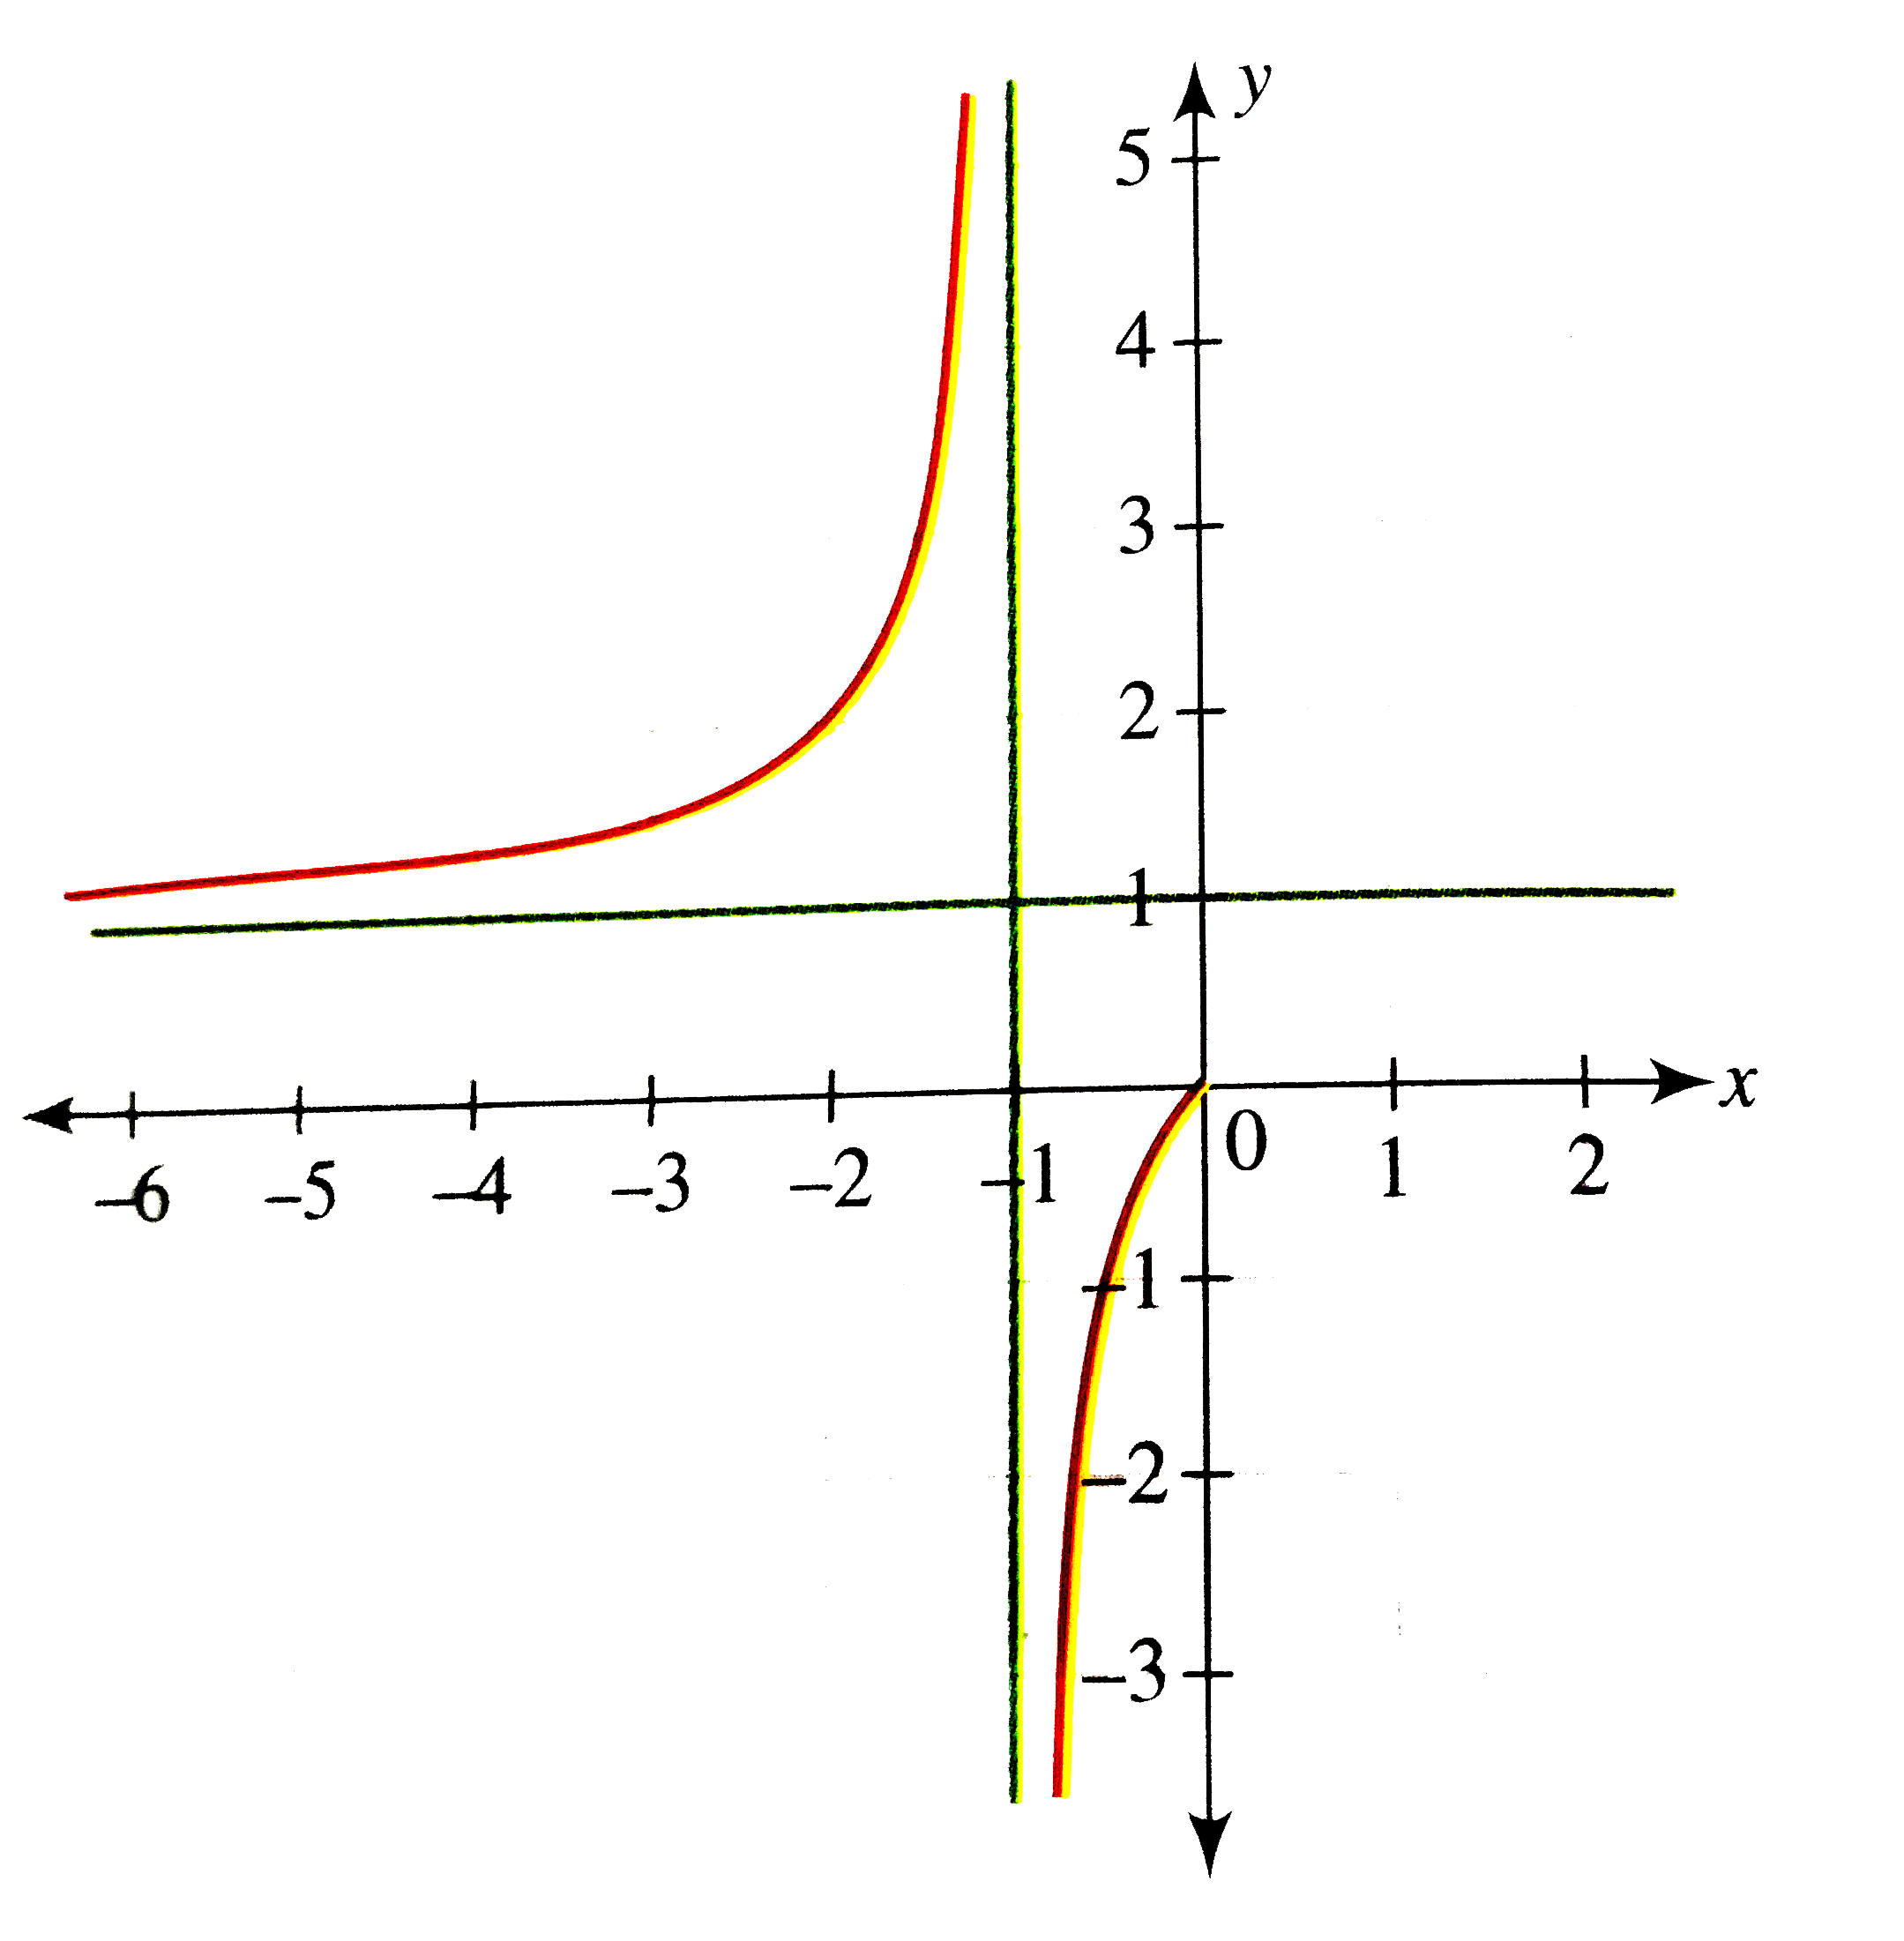
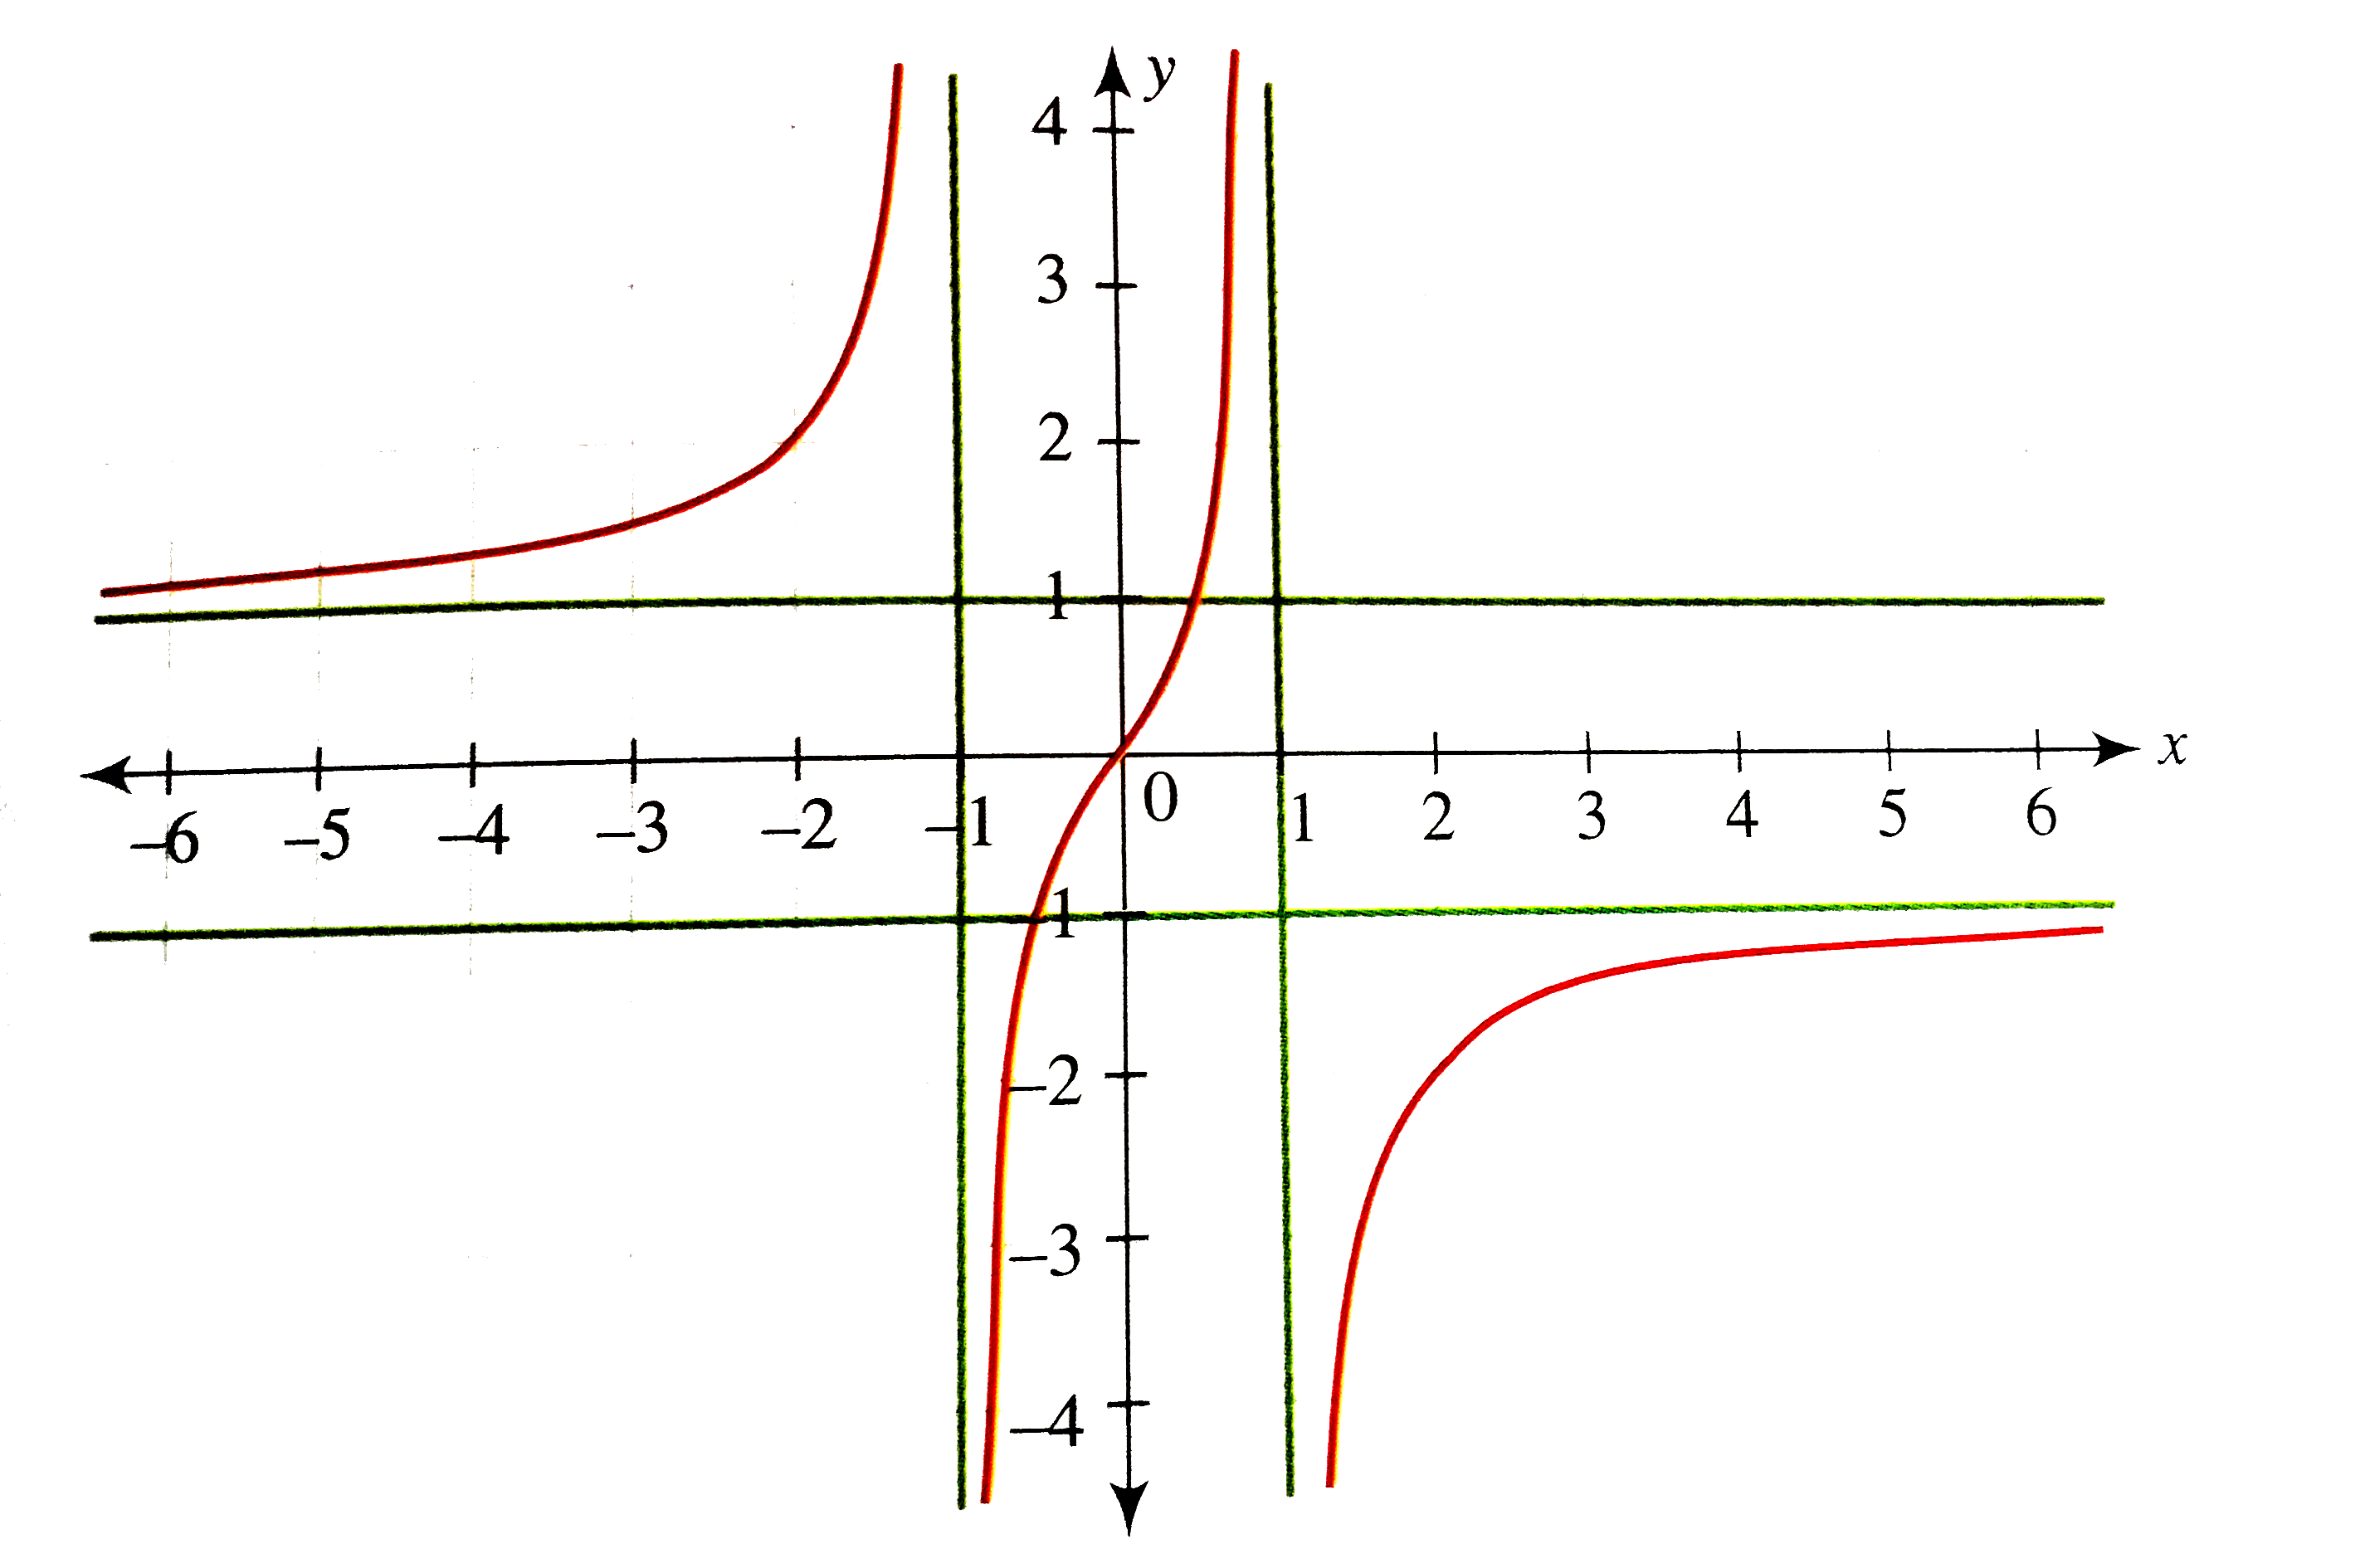
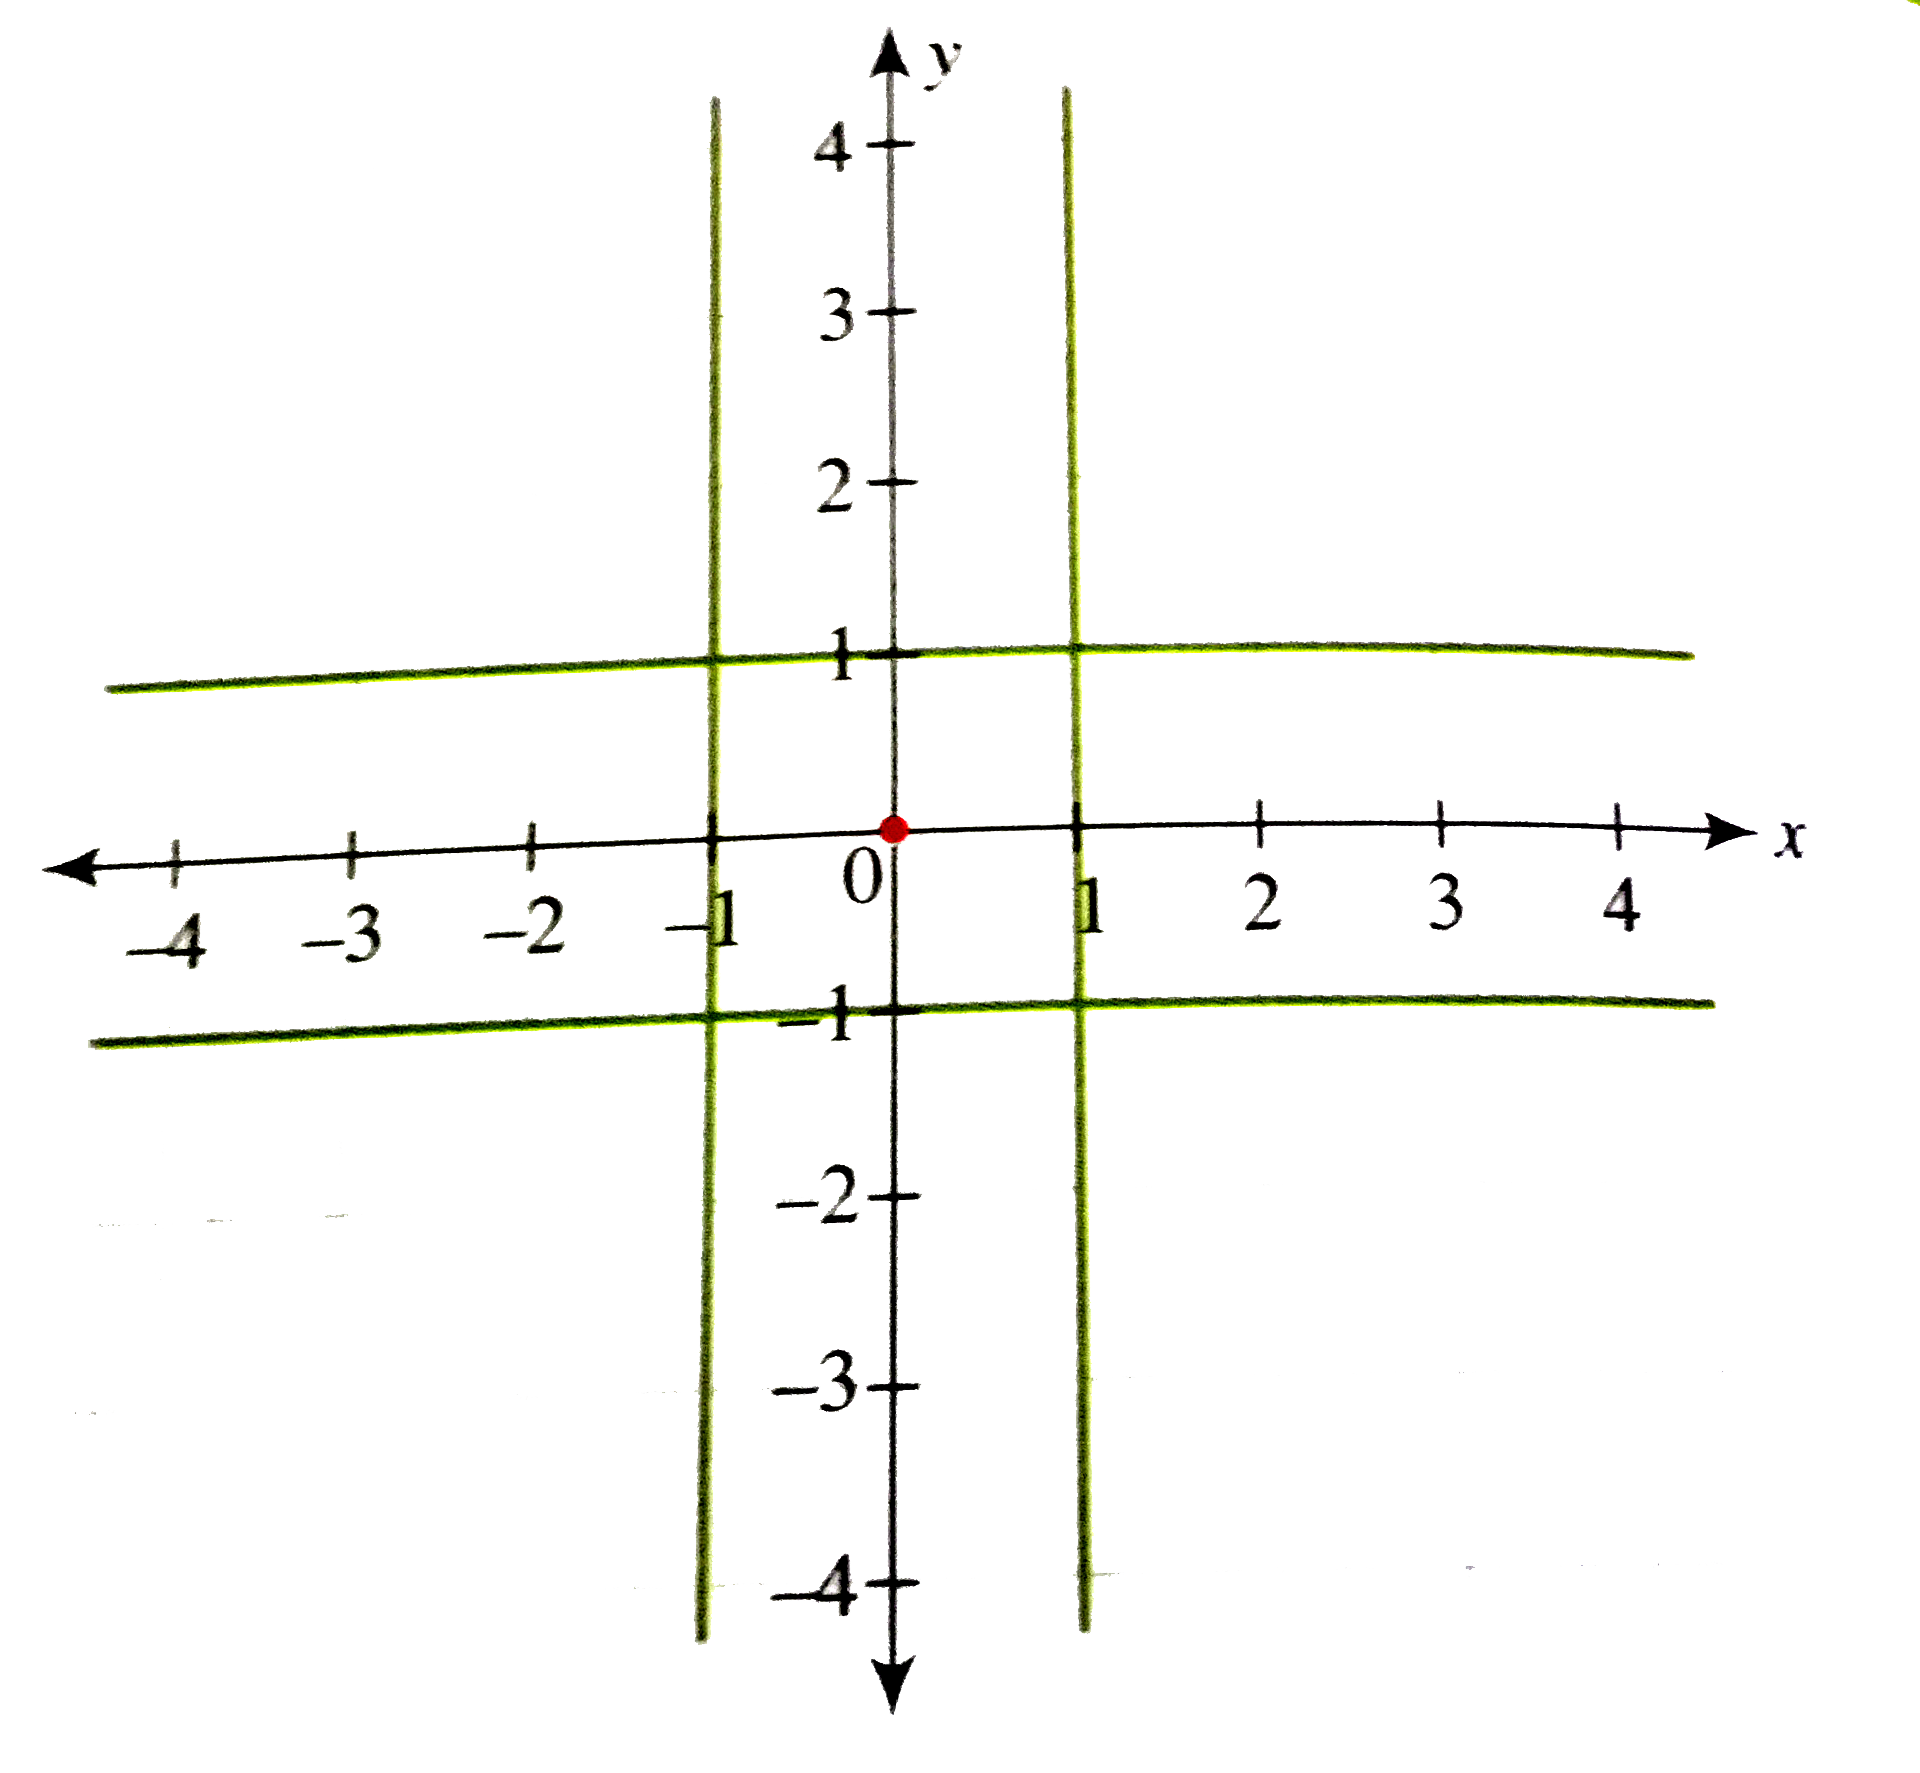
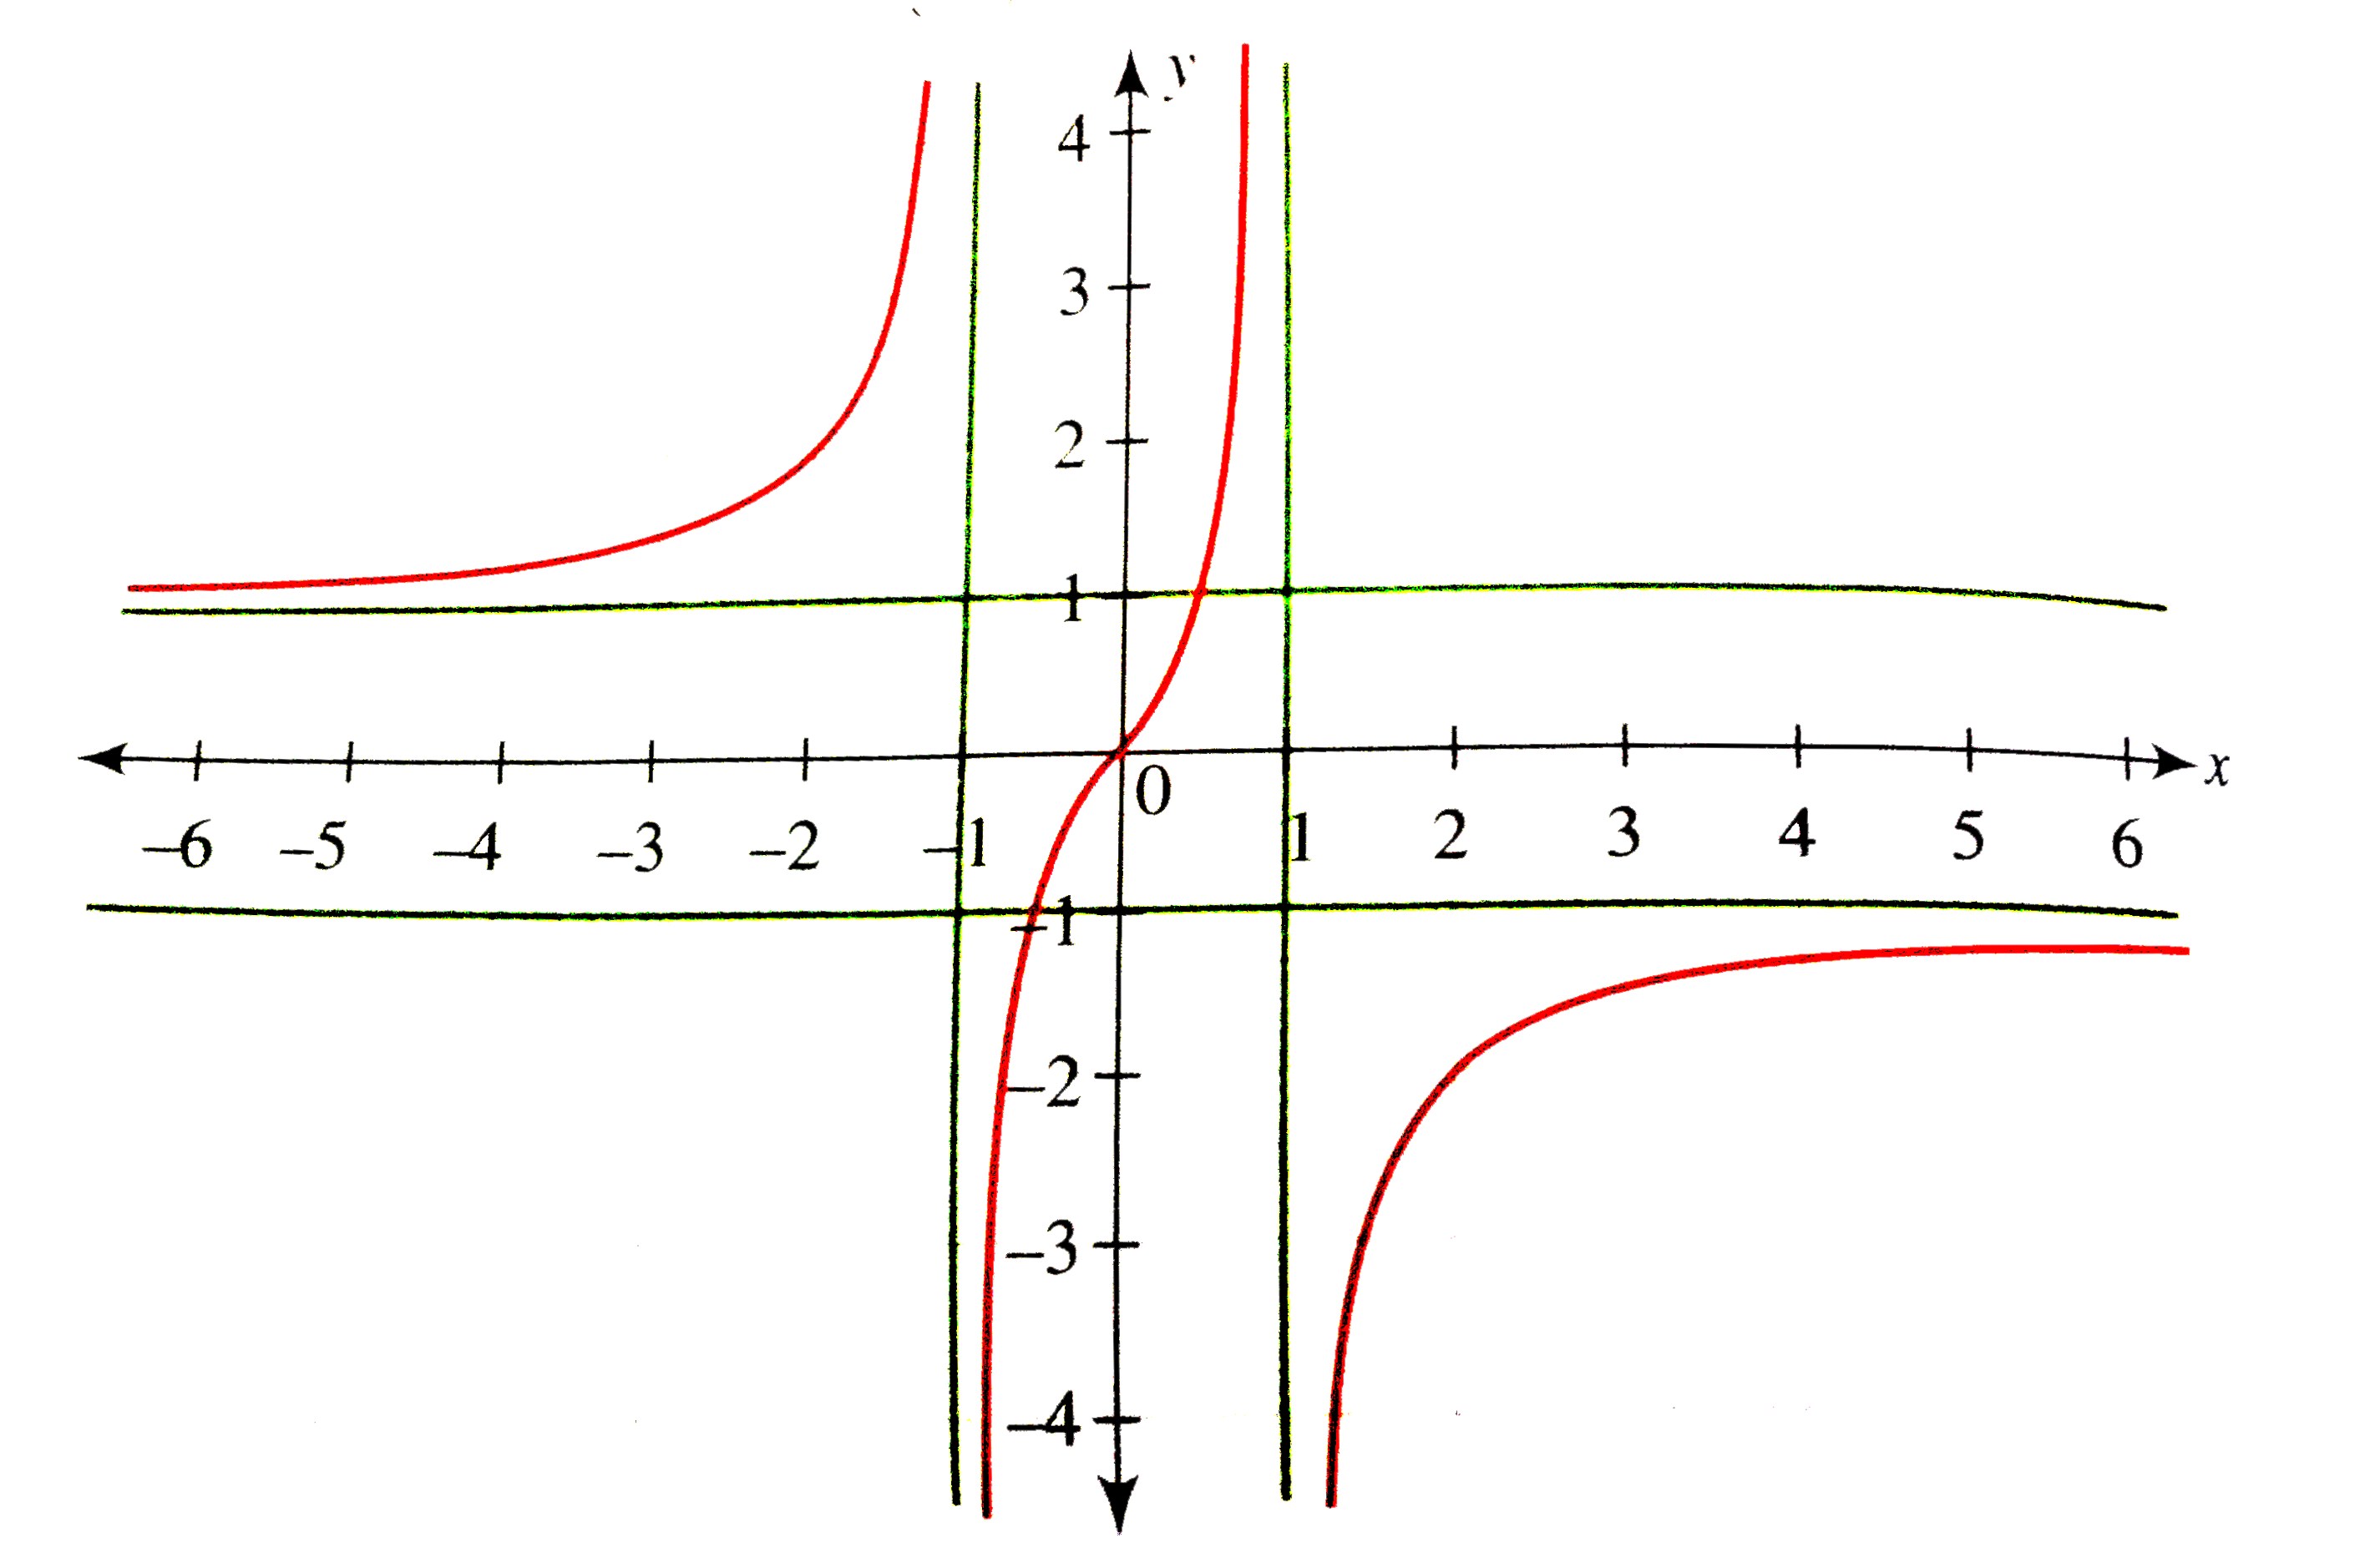
- Draw the graph of the function f : R- {-1, 1} rarr R.f(x)=(x)/(1-|x|).
Text Solution
|
- Draw the graph of y=(x-1)(x^(2)-x+1).
Text Solution
|
- Draw the graph of y=(x^(2)-x^(5))(x-2)^(3).
Text Solution
|
- Let P\ a n d\ Q be any two points. Find the coordinates of the point R...
Text Solution
|
- Draw the graphs of (i) y=x^(2)(x-1)|x-2| (ii) y=x^(3)(x-1)|x-2|
Text Solution
|
- Write a possible rational function h with a hole at x = 5, a vertical ...
Text Solution
|
- Draw the graph of y=f(x)=(x^(2))/(x^(2)+1).
Text Solution
|
- Draw graph of y=(x^(2)-6x+4)/(x^(2)+2x+4).
Text Solution
|
- Draw the graph of f(x)=(x^(2)-8x+15)/(x^(2)-2x).
Text Solution
|
- Draw the graph of f(x)=(5x^(2))/((x-1)^(3)).
Text Solution
|
- Draw the graph of f(x)=(2|x-1|)/(x^(2)+1).
Text Solution
|
- Draw the graph of y=(1)/(x+1)+(1)/(x)+(1)/(x-2).
Text Solution
|
- Draw the graph of y=x+1/x
Text Solution
|
- Draw the graph of y=((x+6)(x+2)x(x-2))/((x-3)(x^(2)-x+1)).
Text Solution
|
- Draw the graph of y=(1)/(x^(2)).
Text Solution
|
- Draw graph of y=(x^(3)-2x^(2))/(3(x+1)^(2)).
Text Solution
|
- Draw graph of y=(x^(3)-5x)/(x^(2)+1).
Text Solution
|
- Given C(1) lt C(2) lt C(3) lt C(4) lt C(5) and the function y=f(x) is ...
Text Solution
|