Home
Class 7
MATHS
From the pie graph shown alongside . Fin...

From the pie graph shown alongside . Find the per cent of students that are seventh grades

A

`35%`

B

` 40%`

C

` 25%`

D

` 28%`

Text Solution

Verified by Experts

The correct Answer is:
C
Promotional Banner

Topper's Solved these Questions

  • DATA HANDLING

    S CHAND IIT JEE FOUNDATION|Exercise Question Bank - 24 (b) |15 Videos
  • DATA HANDLING

    S CHAND IIT JEE FOUNDATION|Exercise Self Assessment Sheet - 24 |10 Videos
  • DATA HANDLING

    S CHAND IIT JEE FOUNDATION|Exercise Self Assessment Sheet - 24 |10 Videos
  • CIRCUMFERENCE AND AREA OF A CIRCLE

    S CHAND IIT JEE FOUNDATION|Exercise SELF ASSESSMENT SHEET - 22 |10 Videos
  • DECIMALS

    S CHAND IIT JEE FOUNDATION|Exercise SELF ASSESSMENT SHEET |10 Videos

Similar Questions

Explore conceptually related problems

Find his gain per cent.

The Pie-graph given here shows the number of students opting different subjects in a school. If there are a total of 720 students, then by studying the pie-graph answer the questions. The difference in the number of students studying Hindi and Sanskrit subjects is

This graph shows the per cent of students who dropped out of school after completing High School. The point labelled A shows that, in 1996, about 4.7% of students dropped out. (a) In which year was the dropout the rate highest? In which year was it the lowest? (b) When did the per cent of students who dropped out of high school first fall below 5%? (c) About what per cent of students dropped out of high school in 2007? About what per cent of students stayed in high school in 2008?

Compare finding a number when a per cent of the number is known to finding the per cent of one number with that of another number.

The performance of 720 students in an examination for the academic year 2015-16 is shown in a pie chart. Study the pie chart carefully and answer the questions that follow. (i) Find the number of students who passed in the first division. (ii) Find the ratio of number of students who passed to that of failed. (iii) Find the pecentage of the number of students who failed in the examination.

From the following bar graph, find the class in which number of students are half of the other class :

150 students are studying English, Maths or both. 62 per cent of the students are studying English and 68 per cent are studying Maths. How many students are studying both?

Number of students from various school playing various games is given in following table The number of students playing football from school D is what per cent of the total number of students playing all the given games from the school D ? (Round off to 2 digits after decimal )

The Pie-graph given here shows the number of students opting different subjects in a school. If there are a total of 720 students, then by studying the pie-graph answer the questions. The total number of students studying English and Punjabi subjects are

S CHAND IIT JEE FOUNDATION-DATA HANDLING -Question Bank - 24 (a)
  1. Which of the following represents statistical data ?

    Text Solution

    |

  2. In statistics, a suitable graph for representing the partitioning of...

    Text Solution

    |

  3. The following table gives the areas of the oceans of the word : ...

    Text Solution

    |

  4. Which of the following statements is not correct for a bar graph ?

    Text Solution

    |

  5. The given double graph shows the average heights of boys and girls at...

    Text Solution

    |

  6. You want to display a set of data showing the number of students in th...

    Text Solution

    |

  7. The given line graph shows the growth rate of a kitten . During which...

    Text Solution

    |

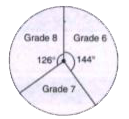
  8. From the pie graph shown alongside . Find the per cent of students t...

    Text Solution

    |

  9. The given pie- chart shows the marks scored by a students in five diff...

    Text Solution

    |

  10. The following bar graph shows the rainfall at selected locations in c...

    Text Solution

    |

  11. The data given below are the times in minutes, it takes seven students...

    Text Solution

    |

  12. A variate takes 11 values which are arranged in ascending order of the...

    Text Solution

    |

  13. From a series of 50 observations, an observation with the value of 45 ...

    Text Solution

    |

  14. A person made 165 telephone calls in the month of May in a year . It w...

    Text Solution

    |

  15. The mean of he marks in Statistics of 100 students in a class was 72 ....

    Text Solution

    |

  16. The numbers 4 and 9 have frequencies x and (x - 1) respectively. If th...

    Text Solution

    |

  17. If the median of x/5,x/4,x/2,x and x/3, "where"xgt0, is 8, find the va...

    Text Solution

    |

  18. The frequency distribution of discrete data given below, the frequency...

    Text Solution

    |

  19. The average of ten numbers is 7. If each number is multiplied by 12...

    Text Solution

    |

  20. The arithmetic mean of the scores of a group of students in a test was...

    Text Solution

    |