Text Solution
Verified by Experts


Topper's Solved these Questions
WHY DO WE FALL ILL?
MTG IIT JEE FOUNDATION|Exercise NCERT SECTION|8 VideosWHY DO WE FALL ILL?
MTG IIT JEE FOUNDATION|Exercise EXERCISE (MULTIPLE CHOICE QUESTIONS (LEVEL-1))|30 VideosWHY DO WE FALL ILL?
MTG IIT JEE FOUNDATION|Exercise OLYMPIAD/HOTS CORNER|10 VideosTISSUES
MTG IIT JEE FOUNDATION|Exercise Olympiad /HOTS Corner |15 Videos
Similar Questions
Explore conceptually related problems
MTG IIT JEE FOUNDATION-WHY DO WE FALL ILL?-SOLVED EXAMPLES
- Give differences between acute diseases and chronic diseases.
Text Solution
|
- Differentiate between infectious and noninfectious diseases.
Text Solution
|
- After eating food, number of people complained of nausea, vomiting, ab...
Text Solution
|
- Name the viral disease which is about to be completely irradicated fro...
Text Solution
|
- AIDS is a viral disease that spreads by sexual contact. Is there any o...
Text Solution
|
- A major disaster like extensive flooding or cyclone has occurred in a ...
Text Solution
|
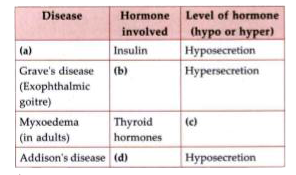
- Study the given table and answer the points a, b, c and d.
Text Solution
|
- It is commonly believed that bad cold takes seven days to subside auto...
Text Solution
|
- Balanced diet is necessary for maintaining healthy body. Comment.
Text Solution
|
- Name such a vaccine which saves the life of babies from three diseases...
Text Solution
|
- Nikita conducted a survey in her neighbourhood and found out that thre...
Text Solution
|
- Why a person suffering from AIDS becomes sick freqently ?
Text Solution
|