A
B
C
D
Text Solution
Verified by Experts
The correct Answer is:


Topper's Solved these Questions
Similar Questions
Explore conceptually related problems
MTG IIT JEE FOUNDATION-NATURAL RESOURCES-Olympiad/HOTS Corner
- A group of students would like to know how the effluent from a factory...
Text Solution
|
- Our atmosphere is made of many layers. The layer nearest to the surfac...
Text Solution
|
- The human made synthetic chemical used in refrigerator is
Text Solution
|
- Pick out the pollutant.
Text Solution
|
- Conversion of fertile land into desert is called desertification. Whic...
Text Solution
|
- Which of the following statements is not true?
Text Solution
|
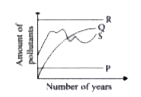
- The given graph shows the amount of pollutants in four rivers P, Q, R ...
Text Solution
|
- Which of the following activities will lead to both air and water poll...
Text Solution
|
- Accumulation of non-biodegradable pesticides in the food chain in incr...
Text Solution
|
- Which of the following plays an important role in nitrogen cycle?
Text Solution
|
- Match column I with column II and select the correct option from the c...
Text Solution
|