Home
Class 6
MATHS
Draw a bar graph using the data given in...

Draw a bar graph using the data given in the following table, which shows the number of bikes manufactured in a factory during the years 2010 to 2013.

Promotional Banner

Topper's Solved these Questions

  • PREP TEST

    MTG IIT JEE FOUNDATION|Exercise SECTION-B|38 Videos
  • PRACTICAL GEOMETRY

    MTG IIT JEE FOUNDATION|Exercise EXERCISE (SUBJECTIVE PROBLEMS) (LONG ANSWER TYPE )|5 Videos
  • PREP TEST -1

    MTG IIT JEE FOUNDATION|Exercise SECTION-B|35 Videos

Similar Questions

Explore conceptually related problems

Following table shows the number of bicycles manufactured in a factory during the years 1998 to 2002. Illustrate this data using a bar graph.Choose a scale of your choice

Following table shows the number of bicycles manufactured in a factory during the years 1998 to 2002. Illustrate this data using a bar graph. Choose a scale of your choice. In which year were the maximum number of bicycles manufactured ?

Following table shows the number of bicycles manufactured in a factory during the years 1998 to 2002. Illustrate this data using a bar graph. Choose a scale of your choice. In which year were the minimum number of bicycles manufactured ?

The following table shows the number of fruits in a fruit shop.Represent the above data by a bar graph

Draw a multiple bar diagram to show the following data :

Read the bar graph given below and answer the following questions: In which year is the number of students maximum?

Study the following bar diagram carefully and answer the following questions. The number of the production of electronic items (TVs and LCDs) in a factory during the period from 2009 to 2013. The ratio of production of TVs in the years 2009 and 2010 is

Study the following bar diagram carefully and answer the following questions. The number of the production of electronic items (TVs and LCDs) in a factory during the period from 2009 to 2013. The ratio of production of LCDs in the year 2011 and 2013 is

Study the following bar diagram carefully and answer the following questions. The number of the production of electronic items (TVs and LCDs) in a factory during the period from 2009 to 2013. The total number of products of electronic items is maximum in the year

The given bar graph presents the data of annual income and annual expenditure of an IT officier in a multinational company during the years 2012 to 2016. For which pair of years, the ratio of savings to expenditure is equal.

MTG IIT JEE FOUNDATION-PREP TEST -SECTION-B
  1. Tulsi bought 10.235 gm of ammonia, 7.34 gm of copper sulphate and 9.03...

    Text Solution

    |

  2. Cost of 4 dozens bananas is Rs 60. How many bananas can be purchased ...

    Text Solution

    |

  3. What is the sum of the fractions, representing the shaded parts of the...

    Text Solution

    |

  4. Represent the fractions on the number line. 2 (1)/(2)

    Text Solution

    |

  5. Represent the fractions on the number line. (6)/(7)

    Text Solution

    |

  6. Represent the fractions on the number line. (2)/(3)

    Text Solution

    |

  7. In an examination, the grades achieved by 30 students of a class are g...

    Text Solution

    |

  8. The length and breadth of a school ground are 150 m and 90 m respectiv...

    Text Solution

    |

  9. Rekha was asked to calculate 125 xx 36, but by mistake she multiplied ...

    Text Solution

    |

  10. A ,\ B and C start at the same time in the same direction to run aroun...

    Text Solution

    |

  11. Write the name of (a) vertices (b) edges , and (c ) faces of the...

    Text Solution

    |

  12. The cost of 1 chart paper is Rs 5 and of 1 marker pen is Rs 18. Neeta...

    Text Solution

    |

  13. Draw a circle of radius 5 cm. Draw any two of its chords. Construct th...

    Text Solution

    |

  14. Priya and Mini share 24 pieces of chocolates in the ratio (1)/(3) : (1...

    Text Solution

    |

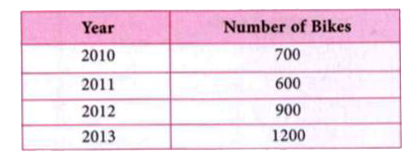
  15. Draw a bar graph using the data given in the following table, which sh...

    Text Solution

    |

  16. The following bar graph represents the number of cold drink bottles so...

    Text Solution

    |

  17. The following bar graph represents the number of cold drink bottles so...

    Text Solution

    |

  18. The following bar graph represents the number of cold drink bottles so...

    Text Solution

    |

  19. A rectangular path of 60 m length and 3 m width is covered by square t...

    Text Solution

    |

  20. Bisect a right angle, using ruler and compasses. Measure each part. Bi...

    Text Solution

    |