Home
Class 7
MATHS
The table below gives the data of touris...

The table below gives the data of tourists visiting 5 hill stations over two consecutive years. Study the table and answer the questions that follow:

(a) Draw a double bar graph to depict the above information using appropriate scale.
(b) Which hill station was visited by the maximum number of tourists in 2008?
(c) Which hill station was visited by the least number of tourists in 2009?
(d) In which hill stations was there increase in number of tourists in the year 2009?

Promotional Banner

Topper's Solved these Questions

  • PREP TEST 1

    MTG IIT JEE FOUNDATION|Exercise SECTION-B|29 Videos
  • PERIMETER AND AREA

    MTG IIT JEE FOUNDATION|Exercise OLYMPIAD/HOTS CORNER |20 Videos
  • PREP TEST 2

    MTG IIT JEE FOUNDATION|Exercise SECTION-B|30 Videos

Similar Questions

Explore conceptually related problems

Which hill station is-called as the Queen of the Satpuras'?

The table below compares the population (in hundreds) of 4 towns over two years: Study the table and answer the following questions: (a) Draw a double bar graph using appropriate scale to depict the above information. (b) In which town was the population growth maximum? (c) In which town was the population growth least?

The First Hills Stations

The given table shows the number of tourists who visited Taj Mahal during different months. Month Draw a bar graph to represent the above information by using appropriate scale.

Which hill station's name means place of the thunderbolt ?

The data given below shows the production of motor bikes in a factory for some months of two consecutive years. Study the table given above and answer the following questions: (a) Draw a double bar graph using appropriate scale to depict the above information and compare them. (b) In which year was the total output the maximum? (c) Find the mean production for the year 2007. (d) For which month was the difference between the production for the two years the maximum? (e) In which month for the year 2008, the production was the maximum? (l) In which month for the year 2007, the production was the least?

MTG IIT JEE FOUNDATION-PREP TEST 1 -SECTION-B
  1. Find the area of the shaded portion.

    Text Solution

    |

  2. From the sum of x^2 - y^2 - 1, y^2 - x^2 - 1 and 1 - x^2 - y^2 " subtr...

    Text Solution

    |

  3. If one side of a square is represented by 18x - 20 and the adjacent si...

    Text Solution

    |

  4. Find the median of the following data: 2,2,0,4,13,12,6,9,5,11

    Text Solution

    |

  5. Compare the following exponentials by using gt or lt (i) 10^(-13) ...

    Text Solution

    |

  6. In the given figure, AE || GF || BD, AB || CG || DF and angleCHE = 120...

    Text Solution

    |

  7. Draw all lines of symmetry for each of the following figures as given ...

    Text Solution

    |

  8. Two adjacent sides PS and RS of the parallelogram PQRS are 6 cm and 12...

    Text Solution

    |

  9. In the given figure, QS bot PR, RT bot PQ and QS =RT Is triangle...

    Text Solution

    |

  10. Following cards are kept on a table. What is the probability of g...

    Text Solution

    |

  11. Chalk contains 10% calcium, 3% carbon and 12% oxygen. Find the amount ...

    Text Solution

    |

  12. The lengths of two sides of an isosceles triangle are 9 cm and 20 cm. ...

    Text Solution

    |

  13. Aahuti purchased a house for Rs. 50,59,700 and spent Rs. 40300 on its ...

    Text Solution

    |

  14. Garima bought 5 kg 400 g apples and 4 kg 250 g oranges. Latika bought ...

    Text Solution

    |

  15. In Fig. 5.49, AB||CD, AF||ED, angleAFC = 68^(@) and angleFED = 42^(...

    Text Solution

    |

  16. Identify the terms (other than constants) and write their numerical co...

    Text Solution

    |

  17. List four rational numbers between (5)/(7) and (7)/(8).

    Text Solution

    |

  18. Draw an isosceles triangle in which each of the equal sides is of l...

    Text Solution

    |

  19. Do as directed. (i) Write a positive integer and a negative integer ...

    Text Solution

    |

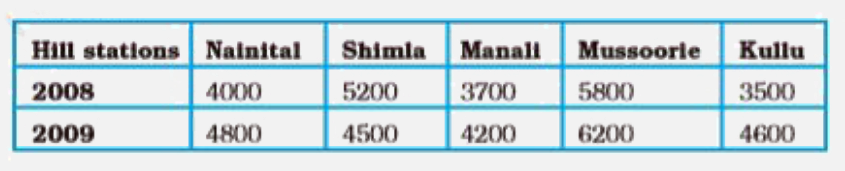
  20. The table below gives the data of tourists visiting 5 hill stations ov...

    Text Solution

    |