Text Solution
Verified by Experts


Topper's Solved these Questions
IMPROVEMENT IN FOOD RESOURCES : PLANTS
CENGAGE BIOLOGY|Exercise CONSOLIDATED EXERCISE (MCQ)|27 VideosIMPROVEMENT IN FOOD RESOURCES : PLANTS
CENGAGE BIOLOGY|Exercise OLYMPIAD AND NTSE LEVEL EXERCISES|10 VideosIMPROVEMENT IN FOOD RESOURCES : PLANTS
CENGAGE BIOLOGY|Exercise MANDATORY EXERCISE (Exercise Set II)|20 VideosHEALTH, HYGIENE, AND DISEASES
CENGAGE BIOLOGY|Exercise CHALLENGING EXERCISE|2 VideosTISSUES
CENGAGE BIOLOGY|Exercise CHALLENGING EXERCISE|2 Videos
Similar Questions
Explore conceptually related problems
CENGAGE BIOLOGY-IMPROVEMENT IN FOOD RESOURCES : PLANTS-CONSOLIDATED EXERCISE
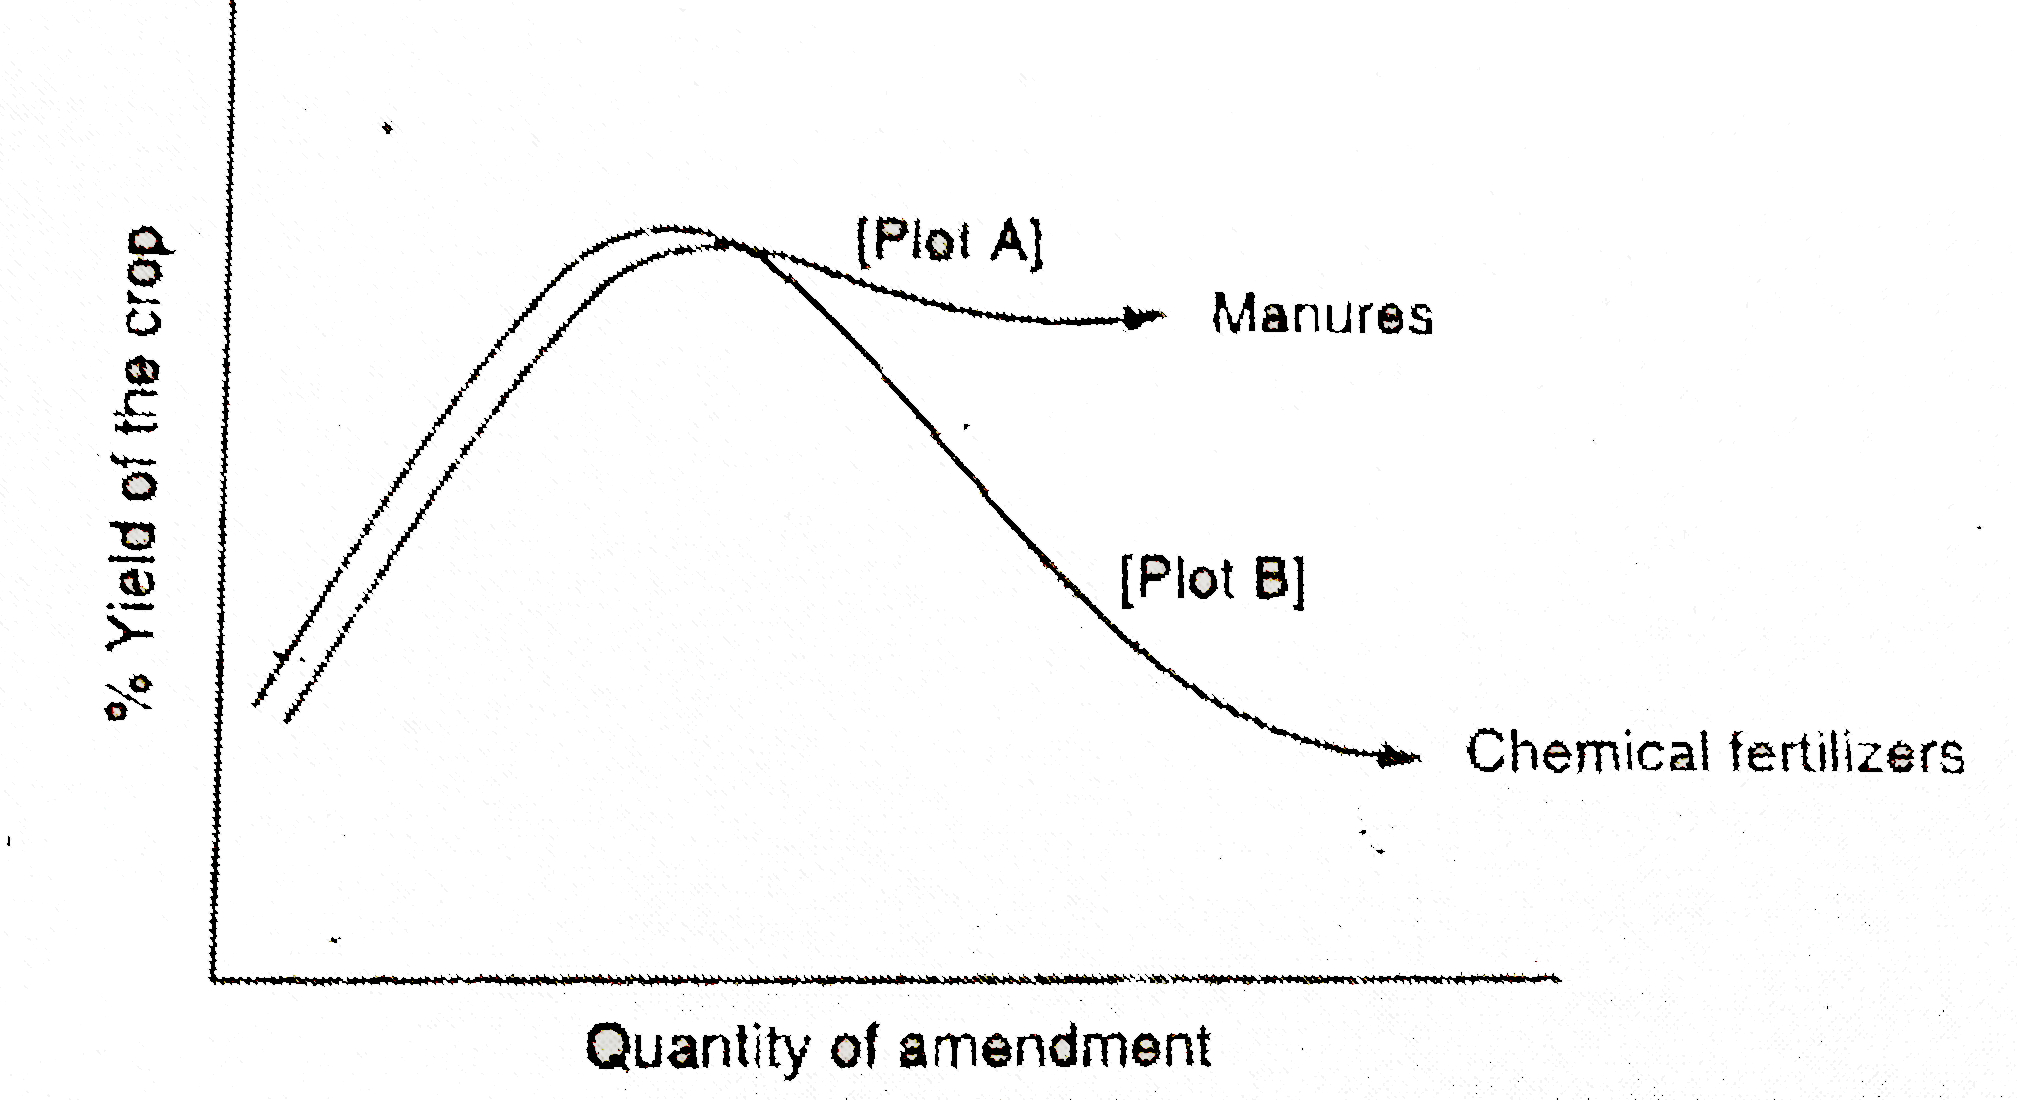
- The figure shows two crop fields (plots A and B) have been treated by ...
Text Solution
|
- The figure shows two crop fields (plots A and B) have been treated by ...
Text Solution
|
- The figure shows two crop fields (plots A and B) have been treated by ...
Text Solution
|
- Which of the following conditions will give most benefits? Why? (a)...
Text Solution
|
- Suggest the correct reason for the following: A farmer was advised n...
Text Solution
|
- Match the following:
Text Solution
|
- Match the following with one or more than one correct answer:
Text Solution
|