


Topper's Solved these Questions
NUTRITION IN PLANTS AND ANIMALS
CENGAGE BIOLOGY|Exercise CONSOLIDATED EXERCISE (MCQs)|63 VideosNUTRITION IN PLANTS AND ANIMALS
CENGAGE BIOLOGY|Exercise OLYMPIAD AND NTSE LEVEL EXERCISES |10 VideosNUTRITION IN PLANTS AND ANIMALS
CENGAGE BIOLOGY|Exercise MANDATORY EXERCISE (EXERCISE SET II) |23 VideosNERVOUS SYSTEM AND SENSE ORGANS : CONTROL AND CO-ORDINATION
CENGAGE BIOLOGY|Exercise CHALLENGING EXERCISE|2 VideosREPRODUCTION
CENGAGE BIOLOGY|Exercise CHALLENGING EXERCISE |3 Videos
Similar Questions
Explore conceptually related problems
CENGAGE BIOLOGY-NUTRITION IN PLANTS AND ANIMALS -CONSOLIDATED EXERCISE
- Complete the crossword puzzle using the clues given below: Across ...
Text Solution
|
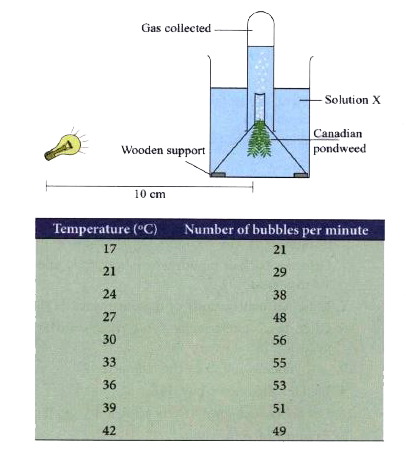
- Diagram below depicts an experiment to find the effect of temperature ...
Text Solution
|
- Diagram below depicts an experiment to find the effect of temperature ...
Text Solution
|
- Diagram below depicts an experiment to find the effect of temperature ...
Text Solution
|
- Diagram below depicts an experiment to find the effect of temperature ...
Text Solution
|
- Match the following :
Text Solution
|
- Match the following :
Text Solution
|
- Assertion. Gall bladder may develop small pebbles the gall stones, in ...
Text Solution
|
- Label the following diagram using these labels: Water, carbohydrate, c...
Text Solution
|