Text Solution
Verified by Experts


Topper's Solved these Questions
Similar Questions
Explore conceptually related problems
CENGAGE BIOLOGY-NUTRITION IN PLANTS AND ANIMALS -CHALLENGING EXERCISE
- (A) Describe peristalsis and explain why it is necessary for digestion...
Text Solution
|
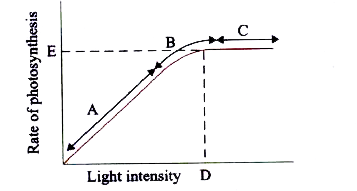
- Figure shows the effect of light on the rate of photosynthesis. B...
Text Solution
|
- Figure shows the effect of light on the rate of photosynthesis. B...
Text Solution
|
- Figure shows the effect of light on the rate of photosynthesis. B...
Text Solution
|