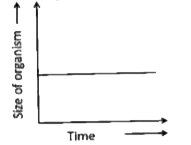
A
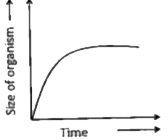
B
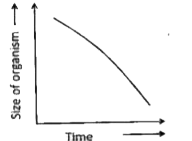
C
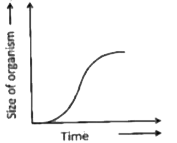
D
Text Solution
AI Generated Solution


Topper's Solved these Questions
LIFE ON EARTH
BETOPPERS|Exercise CONCEPTIVE WORKSHEET|14 VideosLIFE ON EARTH
BETOPPERS|Exercise SUMMATIVE WORKSHEET (MULTIPLE CHOICE QUESTIONS)|5 VideosHEALTH AND HYGIENE
BETOPPERS|Exercise SUMMATIVE WORKSHEET |34 VideosOUR ENVIRONMENT
BETOPPERS|Exercise SUMMATIVE WORKSHEET (ANSWER THE FOLLOWING QUESTIONS:)|24 Videos
Similar Questions
Explore conceptually related problems
BETOPPERS-LIFE ON EARTH-SUMMATIVE WORKSHEET
- Which of the-given graphs correctly represents growth in living organi...
Text Solution
|
- Write true or false in front of the statement given below:
Text Solution
|
- Which of the following are living objects? Milk, honey, orange, hen's ...
Text Solution
|
- Name a plant which is not green, and one animal which does not move ab...
Text Solution
|
- Name one microscopic plant and one microscopic animal.
Text Solution
|
- Which part of leaf takes part in exchange of gases?
Text Solution
|