A
B
C
D
Text Solution
Verified by Experts
The correct Answer is:


BETOPPERS-CONTROL AND COORDINATION-WORKSHEET-3
- Hormones are chemicals that affect various functions of the body such ...
Text Solution
|
- Pituitary is one of the most important glands of the endocrine system....
Text Solution
|
- The given illustration represents the human endocrine glands.Name I, I...
Text Solution
|
- Reproductive organs mature and produce sex cells only at a certain age...
Text Solution
|
- The increased level of glucose in blood con affect the functioning of ...
Text Solution
|
- Tony takes part in a 4x 400.m relay. His body temperature rises rapidl...
Text Solution
|
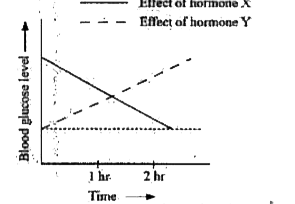
- The given graph illustrates the effect of two hormones " X and Y on bl...
Text Solution
|
- A type of self-regulating system in which increased output from the sy...
Text Solution
|
- Insulin is the hormone secreted by i Its low secretion in the body lea...
Text Solution
|
- Dwarfism is a deficiency disorder in which a person does not attain no...
Text Solution
|
- The proper intake of iodine in diet helps prevent goitre. Iodine is es...
Text Solution
|
- Adrenaline is a hormone secreted by the adrenal gland in humans under ...
Text Solution
|
- Hormones play an important role in regulating various body functions. ...
Text Solution
|