A
B
C
D
Text Solution
Verified by Experts
The correct Answer is:


Topper's Solved these Questions
Similar Questions
Explore conceptually related problems
KVPY PREVIOUS YEAR-QUESTION PAPER 2020-PART-II(BIOLOGY)
- Which ONE of the following is the most likely ratio of blood groups (A...
Text Solution
|
- Match the plants in Column I with their features listed in Column II ,...
Text Solution
|
- A bacteriophage T2 particle contains within its head a double-stranded...
Text Solution
|
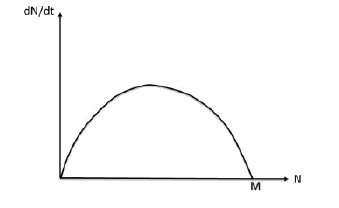
- In the graph below. where N is population size and tis time. M represe...
Text Solution
|
- Match the metabolic pathways in Column I with their corresponding inte...
Text Solution
|
- By comparing mitosis and meiosis occurring in the same organism, which...
Text Solution
|
- Which ONE of the following is likely to occur upon heating a solution ...
Text Solution
|
- Which ONE of the following statements is INCORRECT about the hexokinas...
Text Solution
|
- An ecologist samples trees in multiple forest plots to determine speci...
Text Solution
|
- In medical diagnostics for a disease, sensitivity (denoted a) of a tes...
Text Solution
|