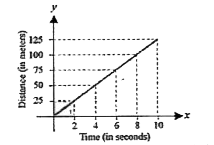
Distance versus time graph of an object is as shown in the figure. The average speed of the object is _____ ms^(-1)
The acceleration versus time graph of a particle is shown in the figure. The respective v-t graph of the particle is . .
The distance- time graph of a body is as shown in the figure. The part of the graph that represent the unifrom speed of the body is
Current l versus time t graph through a conductor is shown in the figure. Average current through the conductor in the interval 0 to 15 s is
A particle moves along x-axis whose potential energy versus x-coordinate graph is shown in the given figure. At x = 0, the particle is released form rest. Two potential wells A and B are shown in the figure. Then,
Four cars A, B and C are moving on a levelled road. Their distance versus time graphs are shown in Fig. Choose the correct statement