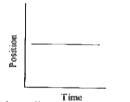
Which of the following position versus time graphs represents a a body at rest?
The accompanying graph of position x versus time t represents the motion of a particle. If p and q are both positive constants, the expression that best describes the acceleration alpha of the particle is
Draw the position-time graph of a stationary object.
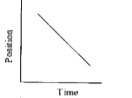
The position versus time graph of the motion of a boy along a straight path is shown in the given figure. The total time for which the boy remains in motion is
A stone is projected at an angle 45^@ with horizontal above horizontal x-axis as shown in figure (and y-axis is vertical). Four graphs representing the magnitude of horizontal (v_x) or magnitude of vertical (v_y) component of velocity of stone w.r.t. time t as shown. Then which of the following magnitude of velocity versus time graph best represents v_x versus t and v_y versus t respectively for the stone.
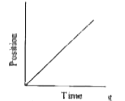
Which graph represents positive acceleration ?
STATEMENT - 1 : The slope on a position-time graph is representative of the acceleration of the object. STATEMENT - 2 : A straight, diagonal line on a position-time graph is representative of an onject with a constant velocity. STATEMENT - 3 : I an object is at rest, then the position-time graph must be a horizontal line located on the time-axis.
A body is thrown vertically upwards which graph represents variation of velocity w.r.t time
The following figure represents the velocity-time graph of a moving car on a road: Which segment of the graph represents the retardation?
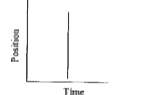
Position (x) versus time (t) graph of a particle is as shown. The velocity is zero at?