Draw distance time graph of a body moving with constant acceleration.
The displacement versus time graph for a body moving in a straight line is shown in figure. Which of the following regions represents the motion when no force is acting on the body
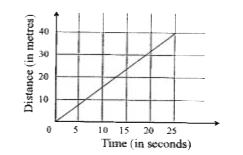
The distance versus time graph of a car is shown in the given figure.
The acceleration versus time graph of a particle moving in a straight line is show in. The velocity-time graph of the particle would be .
The acceleration versus time graph of a particle moving along a straight line is shown in the figure. Draw the respective velocity-time graph Given v=0 at t=0.
The velocity versus time graph of a body moving in a straight line is as shown in the figure below
The distance -time graph of a body moving in a straight line is shown below. Draw the speed time graph of the motion of the body.
The distance-time graph of the motion of an object moving with a contant speed is a straight line.