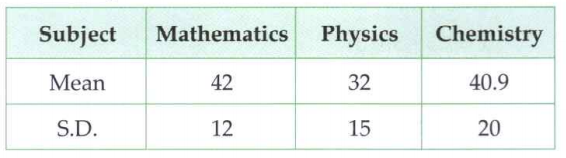
 Which subject shows the highest variability in marks and which shows the lowest?


Similar Questions
Explore conceptually related problems
Recommended Questions
- Solve the following: The mean and standard deviation of marks obtained...
Text Solution
|
- The mean and standard deviation of marks obtained by 50 students of a ...
Text Solution
|
- The mean and standard deviation of marks obtained by 50 students of a ...
Text Solution
|
- The inequation represented by the graph given below is : <img src="htt...
Text Solution
|
- The inequation that best describes the graph given below is <img src=...
Text Solution
|
- The mean and standard deviation of marks obtained by 40 students of a ...
Text Solution
|
- The mean and standard deviation of marks obtained by 50 students of a ...
Text Solution
|
- The mean and standard deviation of maks obtained by 50 students of a c...
Text Solution
|
- The mean and standard deviation of marks obtained by 50 students of a ...
Text Solution
|