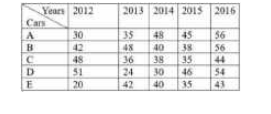
 The number of years, in which the production of cars of type B is less than the average production of type D cars over the years is:
A
B
C
D
Text Solution
Verified by Experts
The correct Answer is:


Topper's Solved these Questions
Similar Questions
Explore conceptually related problems
MOTHERS-DATA INTERPRETATION-MULTIPLE CHOICE QUESTIONS
- The table shows the production of different types of cars (in thousand...
Text Solution
|
- The table shows the production of different types of cars (in thousand...
Text Solution
|
- The table shows the production of different types of cars (in thousand...
Text Solution
|
- The table shows the production of different types of cars If the ...
Text Solution
|
- The table shows the production of different types of cars (in thousand...
Text Solution
|
- The table shows the production of different types of cars (in thousand...
Text Solution
|
- The table shows the production of different types of cars (in thousand...
Text Solution
|
- The table shows the production of different types of cars (in thousand...
Text Solution
|
- The table shows the production of different types of cars (in thousand...
Text Solution
|
- The table shows the production of different types of cars (in thousand...
Text Solution
|
- The table shows the production of different types of cars (in thousand...
Text Solution
|
- The table shows the production of different types of cars by a company...
Text Solution
|
- The table shows the production of different types of cars (in thousand...
Text Solution
|
- The table shows the production of different types of cars by a company...
Text Solution
|
- The table shows the production of different types of cars (in thousand...
Text Solution
|
- The table shows the production of different types of cars (in thousand...
Text Solution
|
- The table shows the production of different types of cars (in thousand...
Text Solution
|
- The table shows the production of different types of cars (in thousand...
Text Solution
|
- The table shows the production of different types of cars (in thousand...
Text Solution
|
- The table shows the production of different types of cars (in thousand...
Text Solution
|