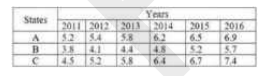
 If the data related to the total production in all three states over these six years is represented in a pie chart, then what will be the central angle of the sector representing the year 2014 ? ( to the nearest whole number )
 A
B
C
D
Text Solution
Verified by Experts
The correct Answer is:


MOTHERS-DATA INTERPRETATION-MULTIPLE CHOICE QUESTIONS
- IF the data of the total students college wise, is represented by a pi...
Text Solution
|
- Table shows the production of rice of three states over six years ...
Text Solution
|
- Table shows the production of rice (in million tonnes) of three states...
Text Solution
|
- What is the average production of rice in state A over the years.
Text Solution
|
- What is the percentage increase in the production of rice in B from 20...
Text Solution
|
- This table shows the percentage of students passing out of five differ...
Text Solution
|
- This table shows the percentage of students passing out of five differ...
Text Solution
|
- What is the ratio of the number of students passing to those falling f...
Text Solution
|
- IF the number of passed out students of all five college is represente...
Text Solution
|
- What is the percentage of marks obtained by R in all the six subjects?
Text Solution
|
- What is the difference between marks obtained by P and T in B , D and ...
Text Solution
|
- What is the average of marks obtained by all the students in subject B...
Text Solution
|
- What is the average percentage of marks obtained by all the students i...
Text Solution
|
- The table shows the number of cars sold by three showrooms over a peri...
Text Solution
|
- The table shows the number of cars sold by three showrooms over a peri...
Text Solution
|
- The table shows the number of cars sold by three showrooms over a peri...
Text Solution
|
- The table shows the number of cars sold by three showrooms over a peri...
Text Solution
|
- Table shows the percentage distribution of the expenditure incurred on...
Text Solution
|
- Table shows the percentage of marks obtained by seven students in six ...
Text Solution
|
- Table shows the sales of books from six branches of a publishing compa...
Text Solution
|