 In which college the average percentage of passing students over the given three years is the
least?
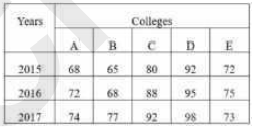
In which college the average percentage of passing students over the given three years is the
least? A
B
C
D
Text Solution
Verified by Experts
The correct Answer is:


Topper's Solved these Questions
Similar Questions
Explore conceptually related problems
MOTHERS-DATA INTERPRETATION-MULTIPLE CHOICE QUESTIONS
- What is the percentage increase in the production of rice in B from 20...
Text Solution
|
- This table shows the percentage of students passing out of five differ...
Text Solution
|
- This table shows the percentage of students passing out of five differ...
Text Solution
|
- What is the ratio of the number of students passing to those falling f...
Text Solution
|
- IF the number of passed out students of all five college is represente...
Text Solution
|
- What is the percentage of marks obtained by R in all the six subjects?
Text Solution
|
- What is the difference between marks obtained by P and T in B , D and ...
Text Solution
|
- What is the average of marks obtained by all the students in subject B...
Text Solution
|
- What is the average percentage of marks obtained by all the students i...
Text Solution
|
- The table shows the number of cars sold by three showrooms over a peri...
Text Solution
|
- The table shows the number of cars sold by three showrooms over a peri...
Text Solution
|
- The table shows the number of cars sold by three showrooms over a peri...
Text Solution
|
- The table shows the number of cars sold by three showrooms over a peri...
Text Solution
|
- Table shows the percentage distribution of the expenditure incurred on...
Text Solution
|
- Table shows the percentage of marks obtained by seven students in six ...
Text Solution
|
- Table shows the sales of books from six branches of a publishing compa...
Text Solution
|
- Table shows the annual Expenditure of a company over the years Wh...
Text Solution
|
- In given bar graph presents the number of different types of vehicles ...
Text Solution
|
- In the given bar graph presents the number of different types of vehic...
Text Solution
|
- Which type of vehicle showed 32% increase in export in 2015 as compare...
Text Solution
|