Home
Class 14
MATHS
The table shows the number of cars sold ...

The table shows the number of cars sold by three showrooms over a period of six years.
यह तालिका तीन शोरूम द्वारा छः वर्षों की अवधि में बेची गयी कारों की संख्या दर्शाती है |
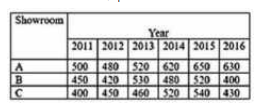
By what percent did the total number of cars sold by all three showrooms decrease during the year 2016, as compared to that in the year 2015 (nearest to one decimal place)?
वर्ष 2015 की तुलना में वर्ष 2016 में तीनों शोरूम के द्वारा बेची गयी कारों की कुल संख्या में कितने प्रतिशत की कमी आयी है ? (एक दशमलव स्थान के निकटतम )

A

0.146

B

0.148

C

0.144

D

0.149

Text Solution

Verified by Experts

The correct Answer is:
A
Promotional Banner

Topper's Solved these Questions

  • COMPOUND INTEREST

    MOTHERS|Exercise CLASS ROOM EXERCISES |180 Videos
  • GEOMETRY

    MOTHERS|Exercise MULTIPLE CHOICE QUESTIONS |413 Videos

Similar Questions

Explore conceptually related problems

The table shows the number of cars sold by three showrooms over a period of six years. यह तालिका तीन शोरूम द्वारा छः वर्षों की अवधि में बेची गयी कारों की संख्या दर्शाती है | What is the average number of cars sold by showroom A over the given six years (nearest to one decimal place)? दिए गए छः वर्षों में शोरूम A द्वारा बेची गयी कारों की औसत संख्या कितनी है ? (एक दशमलव स्थान के निकटतम )

The table shows the number of cars sold by three showrooms over a period of six years. यह तालिका तीन शोरूम द्वारा छः वर्षों की अवधि में बेची गयी कारों की संख्या दर्शाती है | If the total number of cars sold by all three showrooms over the years is represented as a pie-chart, what is the central angle of the sector representing the total number of cars sold in the year 2013 (to the nearest whole number)? यदि तीनों शोरुम द्वारा इन वर्षों के दौरान बेची गयी कारों की कुल संख्या को एक पाई-चार्ट में प्रस्तुत किया जाए, तो वर्ष 2013 में बेची गयी कारों की कुल संख्या को दर्शाने वाले त्रिज्यखंड का केंद्रीय कोण क्या होगा? ( निकटतम पूर्ण संख्या में )

The Table shows the number of cars sold by three showrooms over a period of six years. What is the ratio of the total cars sold by showroom B during the years 2014 and 2016 and the total cars sold by showroom C during 2015 and 2016?

Total number of vehicles (scooters and cars) sold in the year 2005 and 2006 is ______.

The table shows the production of different types of cars (in thousands). यह तालिका एक कंपनी द्वारा अलग-अलग कारों के उत्पादन ( हज़ार में ) को दर्शाती है | The total production of type B cars in 2015 and type C cars in 2013 is what percent more than the total production of type E cars in 2013 and 2014 ? (Correct to one decimal place) 2015 में B प्रकार तथा 2013 में प्रकार की कारों का कुल उत्पादन 2013 तथा 2014 में E प्रकार की कारों के कुल उत्पादन से कितना प्रतिशत अधिक है ? (एक दशमलव स्थान तक)

MOTHERS-DATA INTERPRETATION-MULTIPLE CHOICE QUESTIONS
  1. The table shows the number of cars sold by three showrooms over a peri...

    Text Solution

    |

  2. The table shows the number of cars sold by three showrooms over a peri...

    Text Solution

    |

  3. The table shows the number of cars sold by three showrooms over a peri...

    Text Solution

    |

  4. The table shows the number of cars sold by three showrooms over a peri...

    Text Solution

    |

  5. Table shows the percentage distribution of the expenditure incurred on...

    Text Solution

    |

  6. Table shows the percentage of marks obtained by seven students in six ...

    Text Solution

    |

  7. Table shows the sales of books from six branches of a publishing compa...

    Text Solution

    |

  8. Table shows the annual Expenditure of a company over the years Wh...

    Text Solution

    |

  9. In given bar graph presents the number of different types of vehicles ...

    Text Solution

    |

  10. In the given bar graph presents the number of different types of vehic...

    Text Solution

    |

  11. Which type of vehicle showed 32% increase in export in 2015 as compare...

    Text Solution

    |

  12. The average number of type A,B and D vehicles exported in 2015 was x%...

    Text Solution

    |

  13. The given bar graph presents the target and actual production of AC ma...

    Text Solution

    |

  14. The total target production of AC machines in February, April and May ...

    Text Solution

    |

  15. The actual production of Ac machines in April was that percentage mor...

    Text Solution

    |

  16. In which month the actual production of AC machines was 25% more than ...

    Text Solution

    |

  17. The given Bar graph present the number of students from Science and Ar...

    Text Solution

    |

  18. The given Bar graph present the number of students from Science and Ar...

    Text Solution

    |

  19. What is the ratio of the total number of science students in 2011 and ...

    Text Solution

    |

  20. The given Bar graph present the number of students from Science and Ar...

    Text Solution

    |