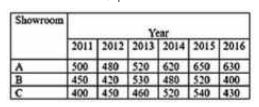
 What is the average number of cars sold by showroom A over the given six years (nearest to one decimal place)?
 A
B
C
D
Text Solution
Verified by Experts
The correct Answer is:


MOTHERS-DATA INTERPRETATION-MULTIPLE CHOICE QUESTIONS
- The table shows the number of cars sold by three showrooms over a peri...
Text Solution
|
- The table shows the number of cars sold by three showrooms over a peri...
Text Solution
|
- The table shows the number of cars sold by three showrooms over a peri...
Text Solution
|
- Table shows the percentage distribution of the expenditure incurred on...
Text Solution
|
- Table shows the percentage of marks obtained by seven students in six ...
Text Solution
|
- Table shows the sales of books from six branches of a publishing compa...
Text Solution
|
- Table shows the annual Expenditure of a company over the years Wh...
Text Solution
|
- In given bar graph presents the number of different types of vehicles ...
Text Solution
|
- In the given bar graph presents the number of different types of vehic...
Text Solution
|
- Which type of vehicle showed 32% increase in export in 2015 as compare...
Text Solution
|
- The average number of type A,B and D vehicles exported in 2015 was x%...
Text Solution
|
- The given bar graph presents the target and actual production of AC ma...
Text Solution
|
- The total target production of AC machines in February, April and May ...
Text Solution
|
- The actual production of Ac machines in April was that percentage mor...
Text Solution
|
- In which month the actual production of AC machines was 25% more than ...
Text Solution
|
- The given Bar graph present the number of students from Science and Ar...
Text Solution
|
- The given Bar graph present the number of students from Science and Ar...
Text Solution
|
- What is the ratio of the total number of science students in 2011 and ...
Text Solution
|
- The given Bar graph present the number of students from Science and Ar...
Text Solution
|
- The given bar graph Presents the Demand and Production of motorcycle o...
Text Solution
|